geom_text, geom_label: 'label' aesthetic shouldn't produce grouping #701
Description
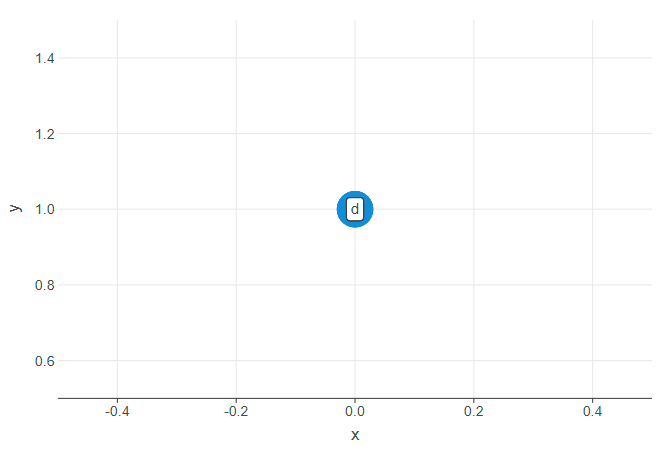
Example:
data = {
    'x': [0, 0, 0, 0],
    'y': [1, 1, 1, 1],
    'l': ["a", "b", "c", "d"],
}

ggplot(data, aes('x', 'y')) + \
    geom_point(position=position_stack(mode='groups'), size=15) + \
    geom_label(aes(label='l'), position=position_stack(mode='groups'))
It means that aes(label='l') adds additional implicit grouping to labels. But it shouldn't.
Expected behaviour: