Welcome to my repository that's designed to showcase my PostgreSQL skills. In this exercise, I worked with employee data to create muliple tables relating to employee information.
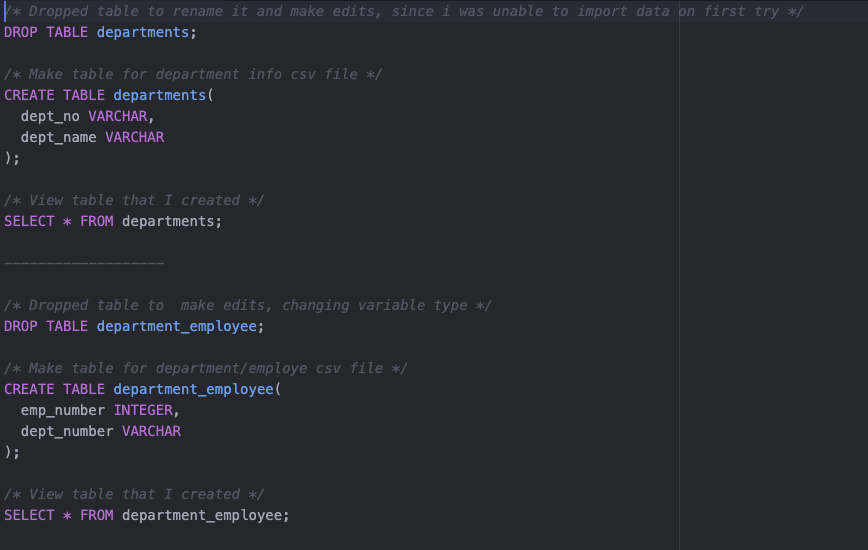
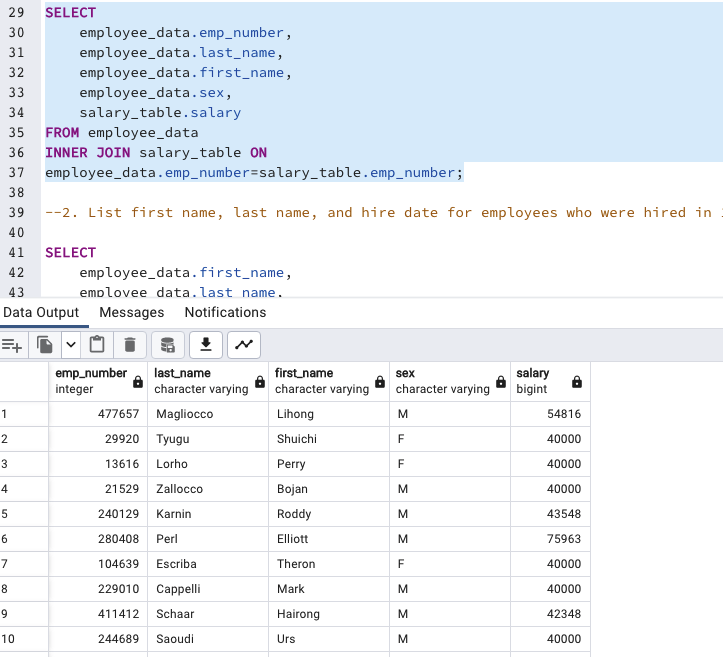
I then ingested data from CSV files into a new database to populate each table. Using the employee ID as the primary record, I performed a series of joins to select data that will aid in answering specific business questions.
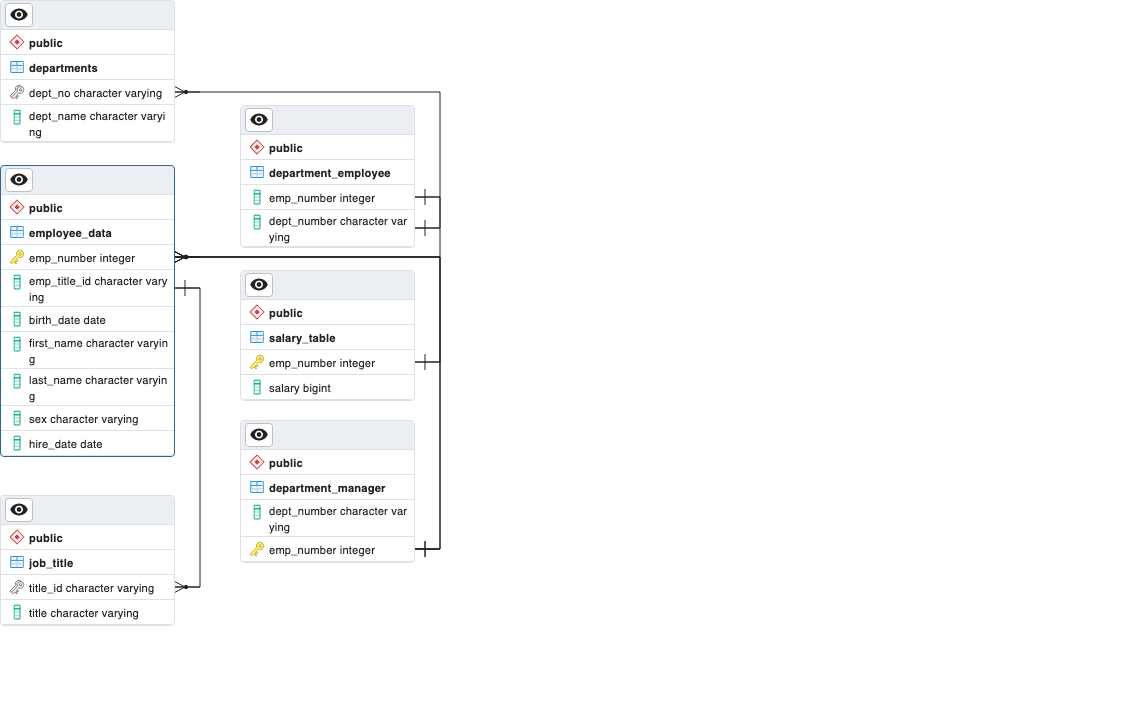
I then created an ERD to show the mapping of key columns to each table.
Finally, I used SQL Alchemy to create an engine. I created a SQL query that joined 3 relevant tables to review the data. I plotted both a histogram that binned salary ranges into categories, then I created a bar graph to visualize employee title against average salary.
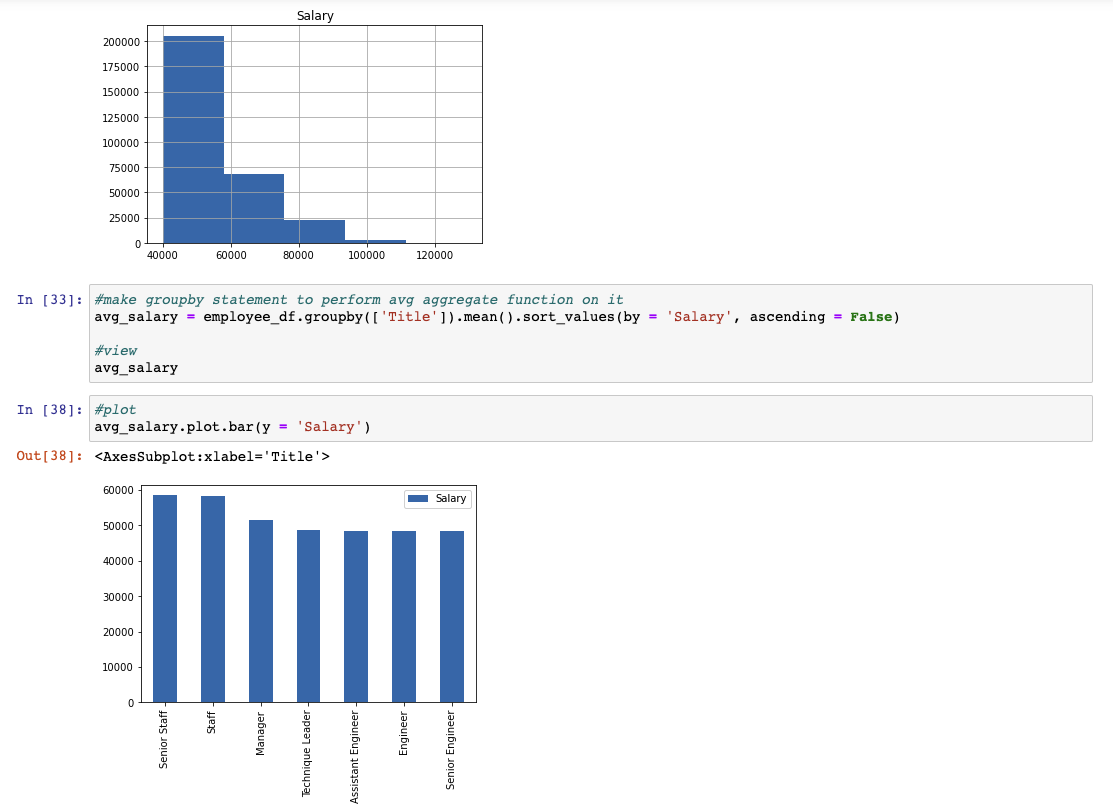
Through this review, I found some suspicious trends, such as the fact that the salary for an employee with the title "assistant engineer" was higher than that of an "engineer."
I suspect that this dataset is either fake, or that the company really needs a compensation analyst to improve operations and pay ranges.