This data set models a company based out of New York City that sells clothing online but they also have in-store style and clothing advice sessions. Customers come in to the store, have sessions/meetings with a personal stylist, then they can go home and order either on a mobile app or website for the clothes they want.
The company is trying to decide whether to focus their efforts on their mobile app experience or their website.
I worked with the data set that includes (fabricated) customer info, such as Email, Address, and their color Avatar. Then it also has numerical value columns:
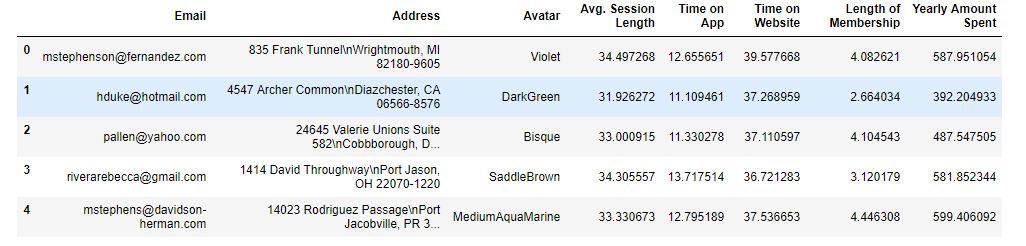
Avg. Session Length: Average session of in-store style advice sessions. Time on App: Average time spent on App in minutes Time on Website: Average time spent on Website in minutes Length of Membership: How many years the customer has been a member.
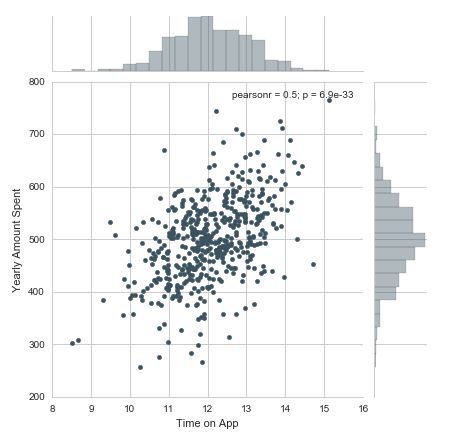
Did analysis between time spent on the app and the yearly amount spent:
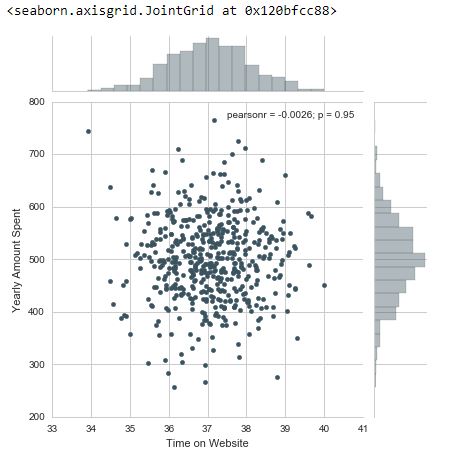
Analysis between time spent on the website and the yearly amount spent:
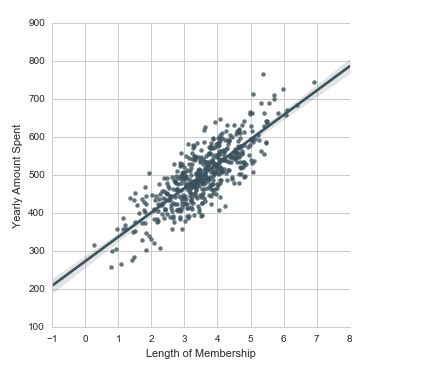
And a linear plot between the length of membership and yearly amount spent
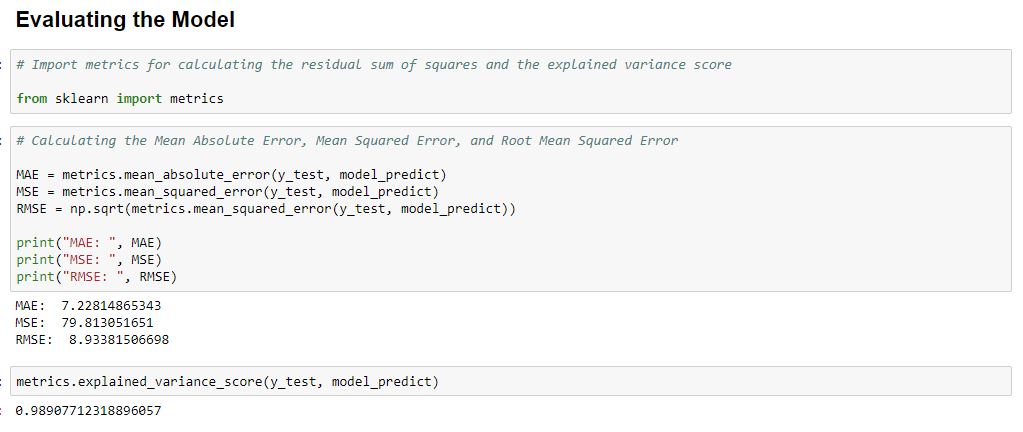
Scikit Learn packages were used to split the data and create a linear regression model
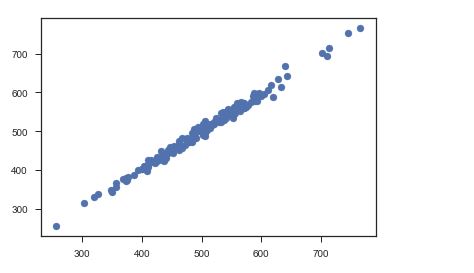
I created a scatter plot which showed the real test values vs. our predicted values:
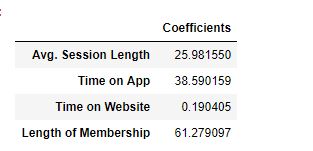
And the coefficients data frame: