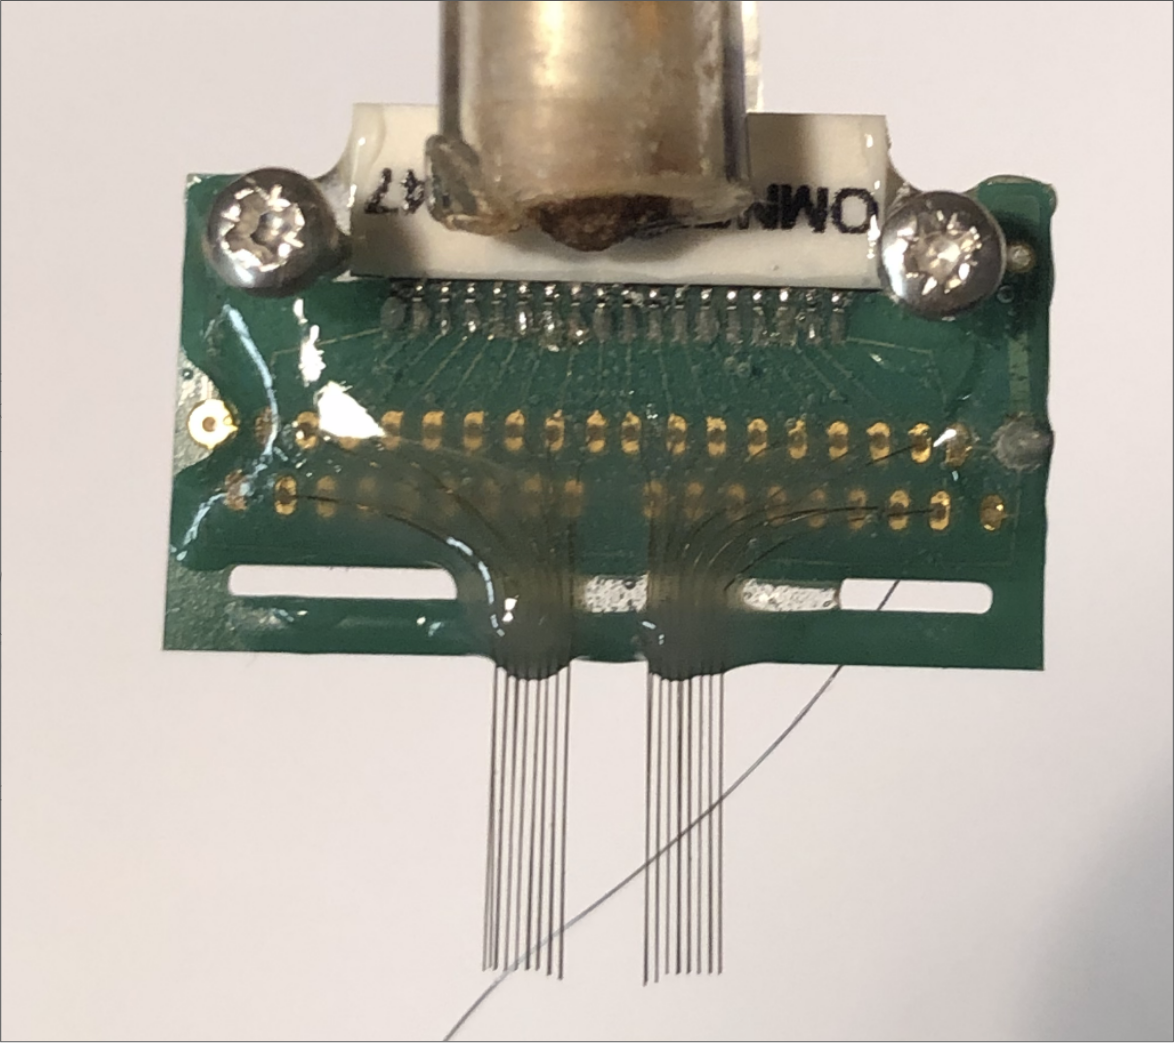
This project studies the different activations in the OFC and BLA during a learning task, it is embedded within a bigger project studying the effect of serotonin on reversal learning tasks in rats. The data is collected from brain electrodes in the aforementained regions.
The data analysis will only include the data from the first phase, so no reversal learning data will be analyzed.
There are 3 main parts:
- The behavior analysis of the rats during different phases of learning
- ERPs plotting for checking whether the task has a direct effect of neural activity
- The main part, a time-frequency analysis of the data using Morlet wavelets for checking differences in activity at different frequencies and different experimental conditions.
Other work has been done, PCA and GED analysis and machine learning for classifying single trial spectrograms in one of the three experimental conditions, that work is not included in the repository, the former for being highly experimental and its results not being conclusive enough to be included, the latter for not having any conclusive results due to the studied regions being detached from somatosensory regions which might yield more obvious results.
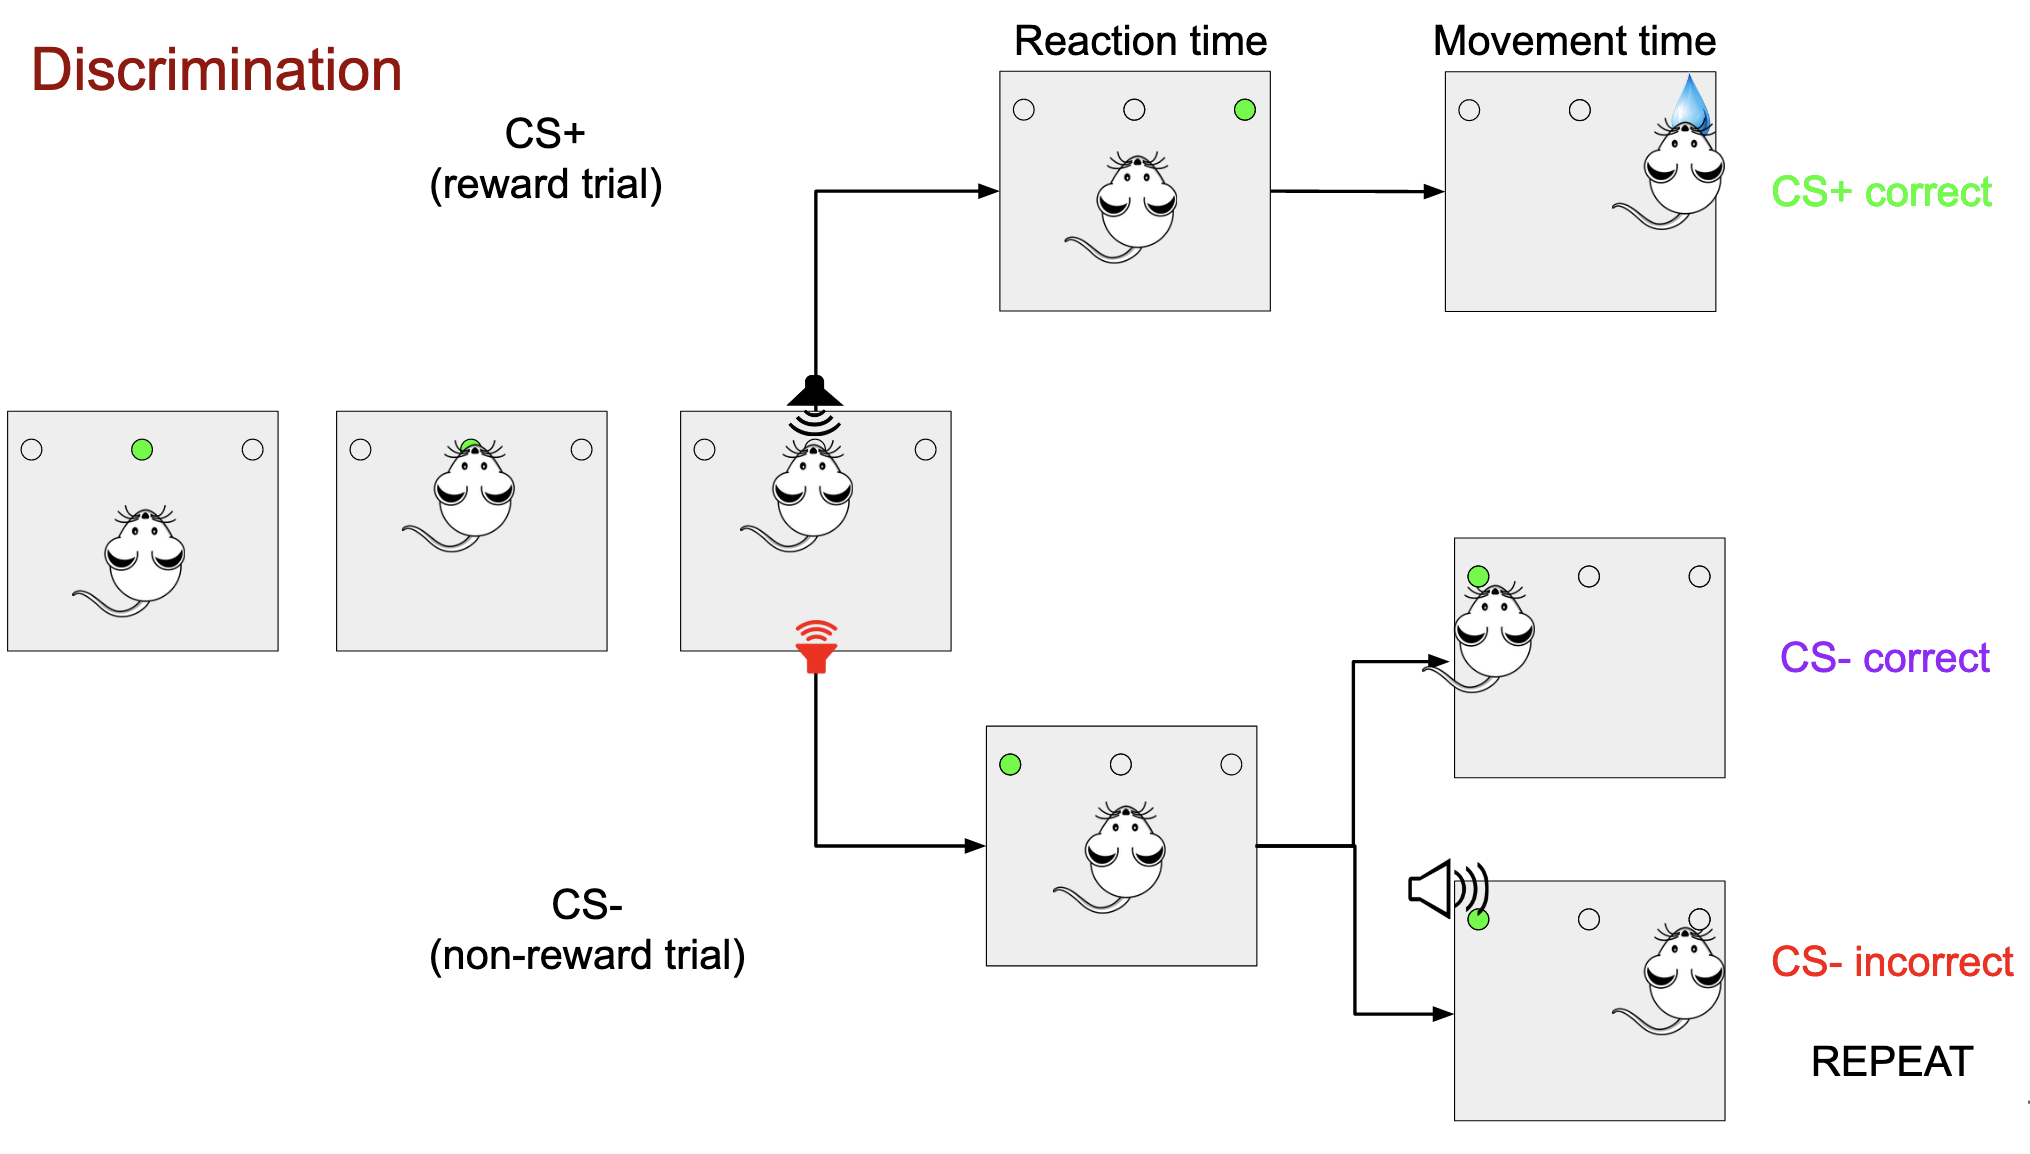
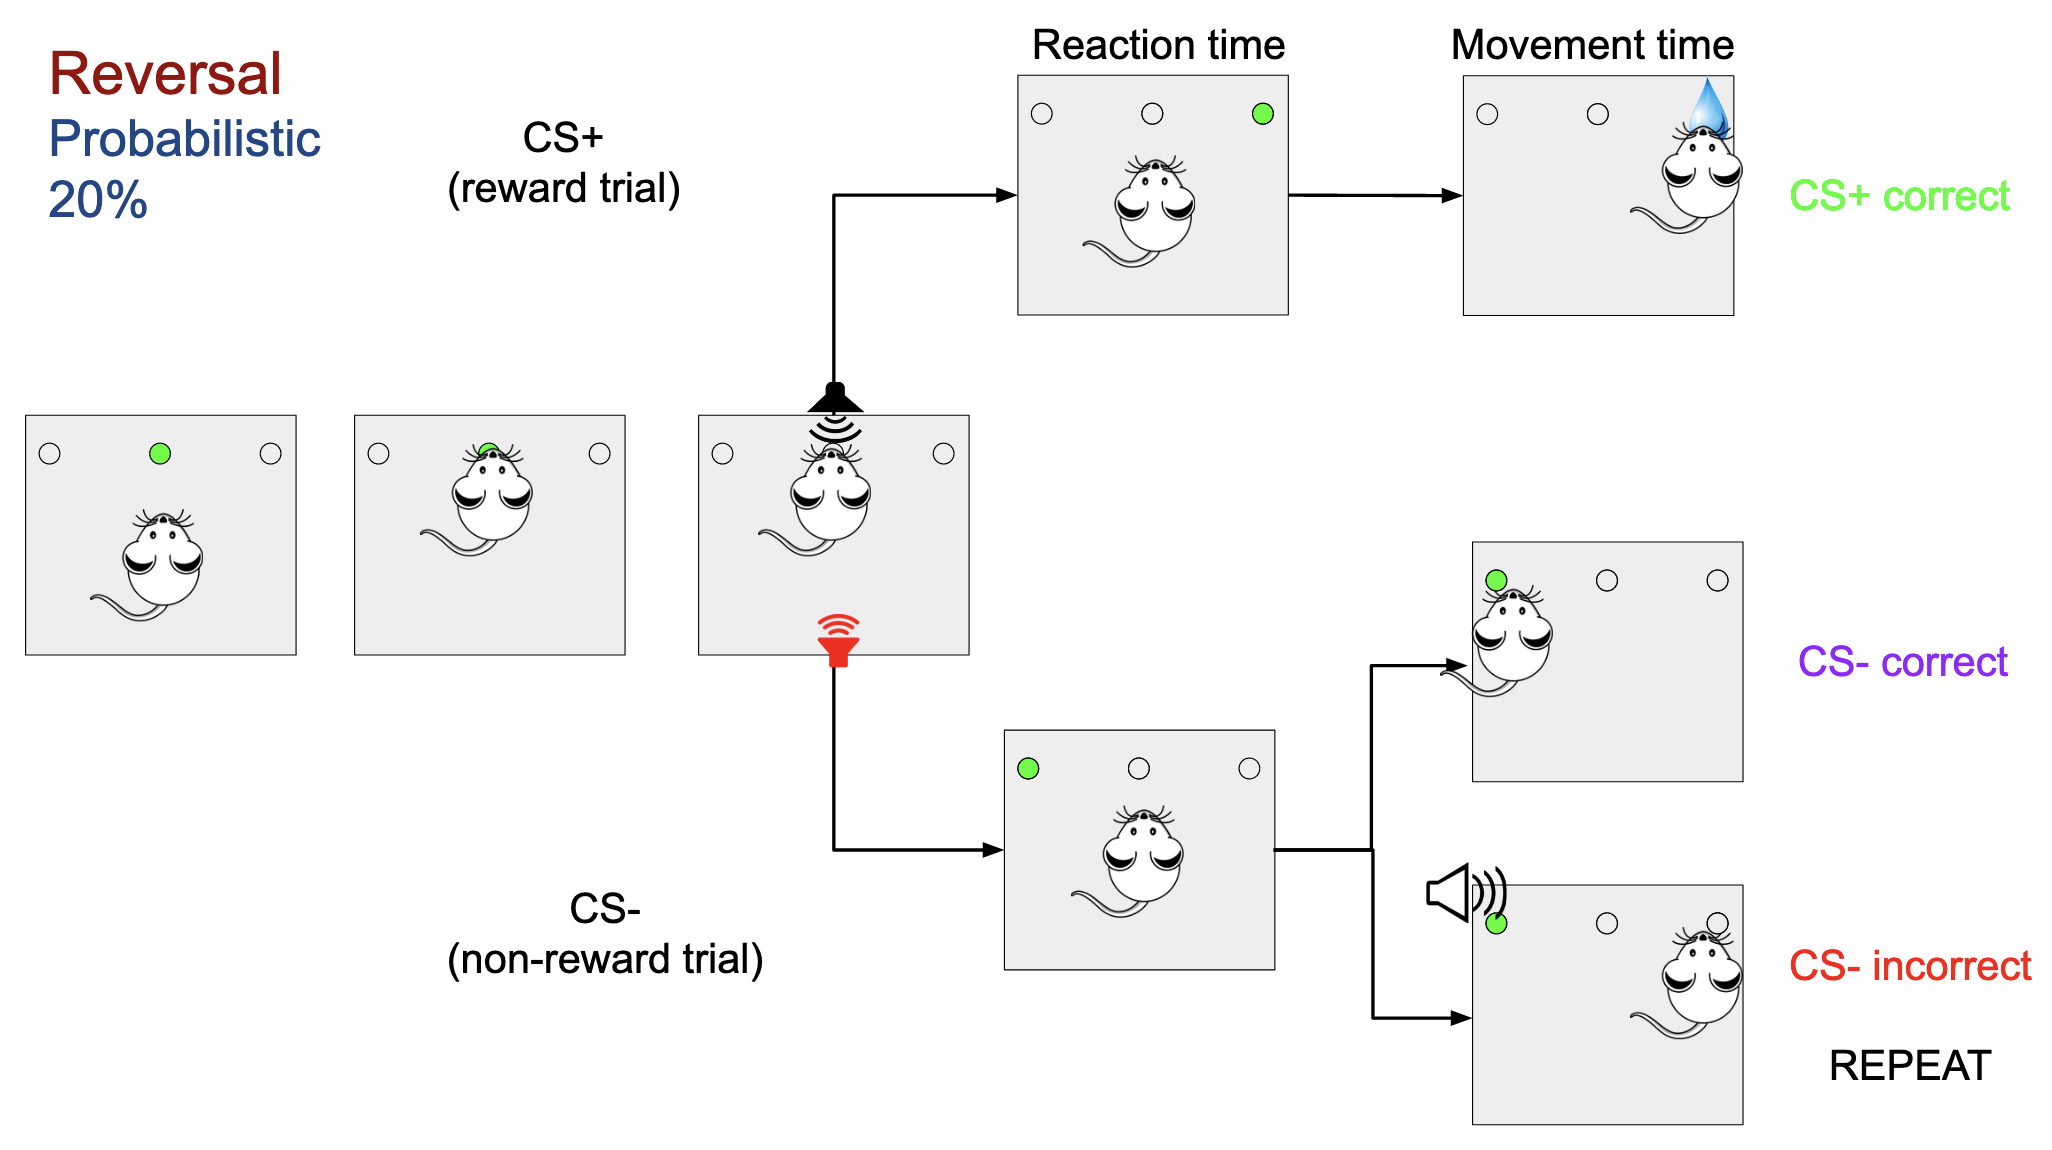
Rats are trained to perform a learning task, they have to introduce their nose inside the central hole of the three that are in the skinner’s box for a trial to be started. At the start of the trial there is a sound played. It can be a sound of frequency 1 or frequency 2, if the frequency corresponds to a Conditioned Stimulus positive (CS+) the rat must go to one of the hole besides the central hole, it is always the same side for all types of trials. If the rat goes to the correct side and introduces its nose inside it, it is given a few ml of water. It has performed a correct CS+ trial. If it goes to the wrong side it performs an incorrect CS+ trial. After performing an incorrect trial, the next trial will be of the same nature as the incorrect one CS+ or CS–.
In case the other frequency is played, it is a Conditioned Stimulus negative (CS-) the rat must go to the other side hole and introduce its nose for it to perform a correct CS-, CS- however does not have any reward associated to it. If instead of going to the correct side, it goes to the wrong side, it performed an incorrect CS-.
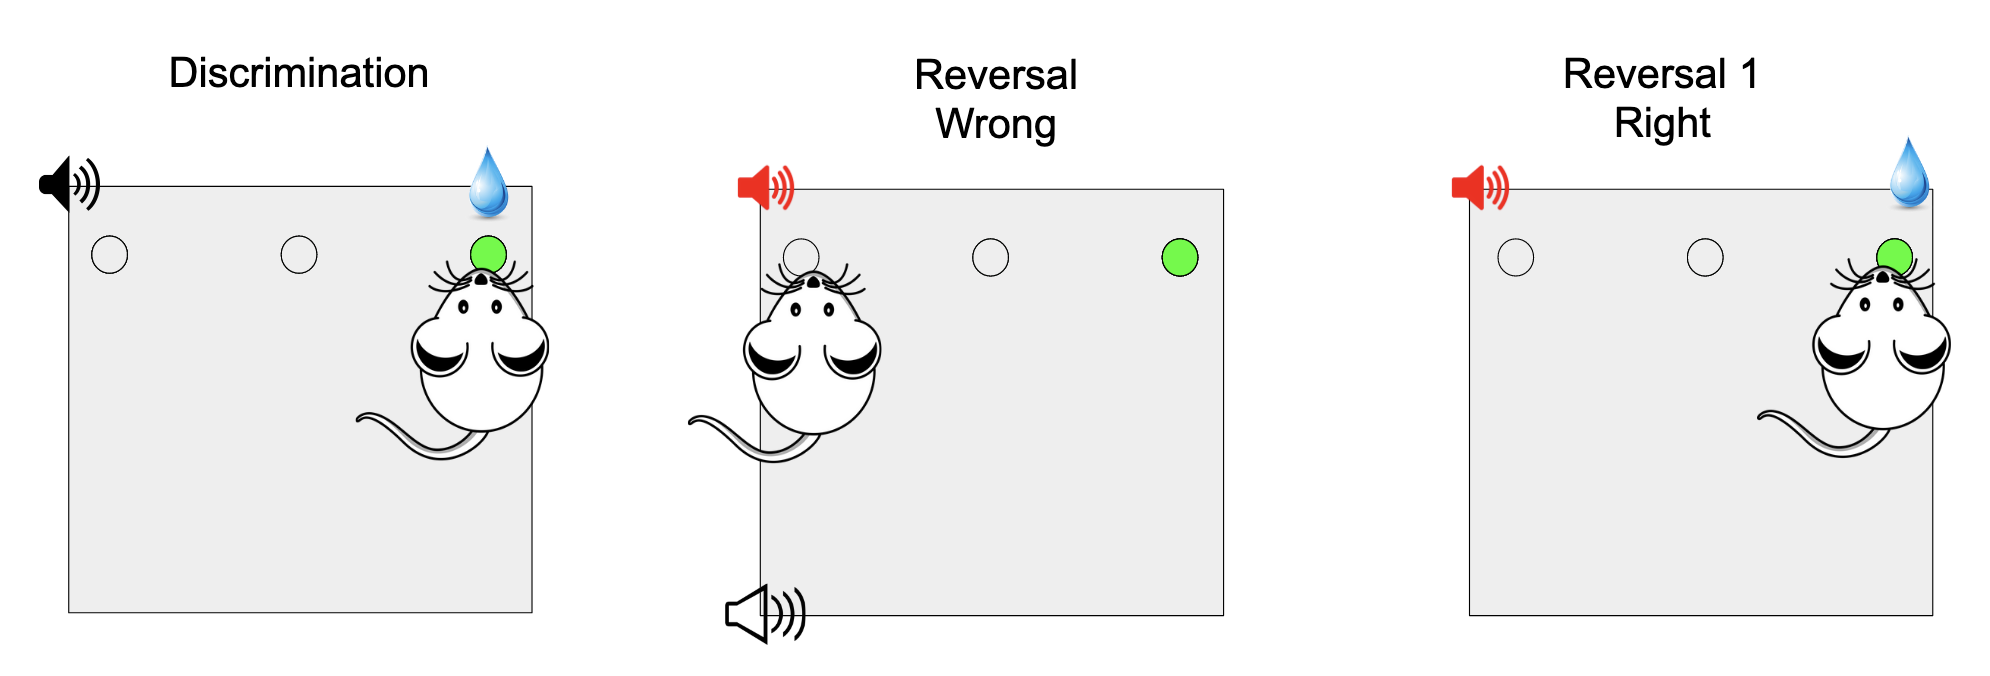
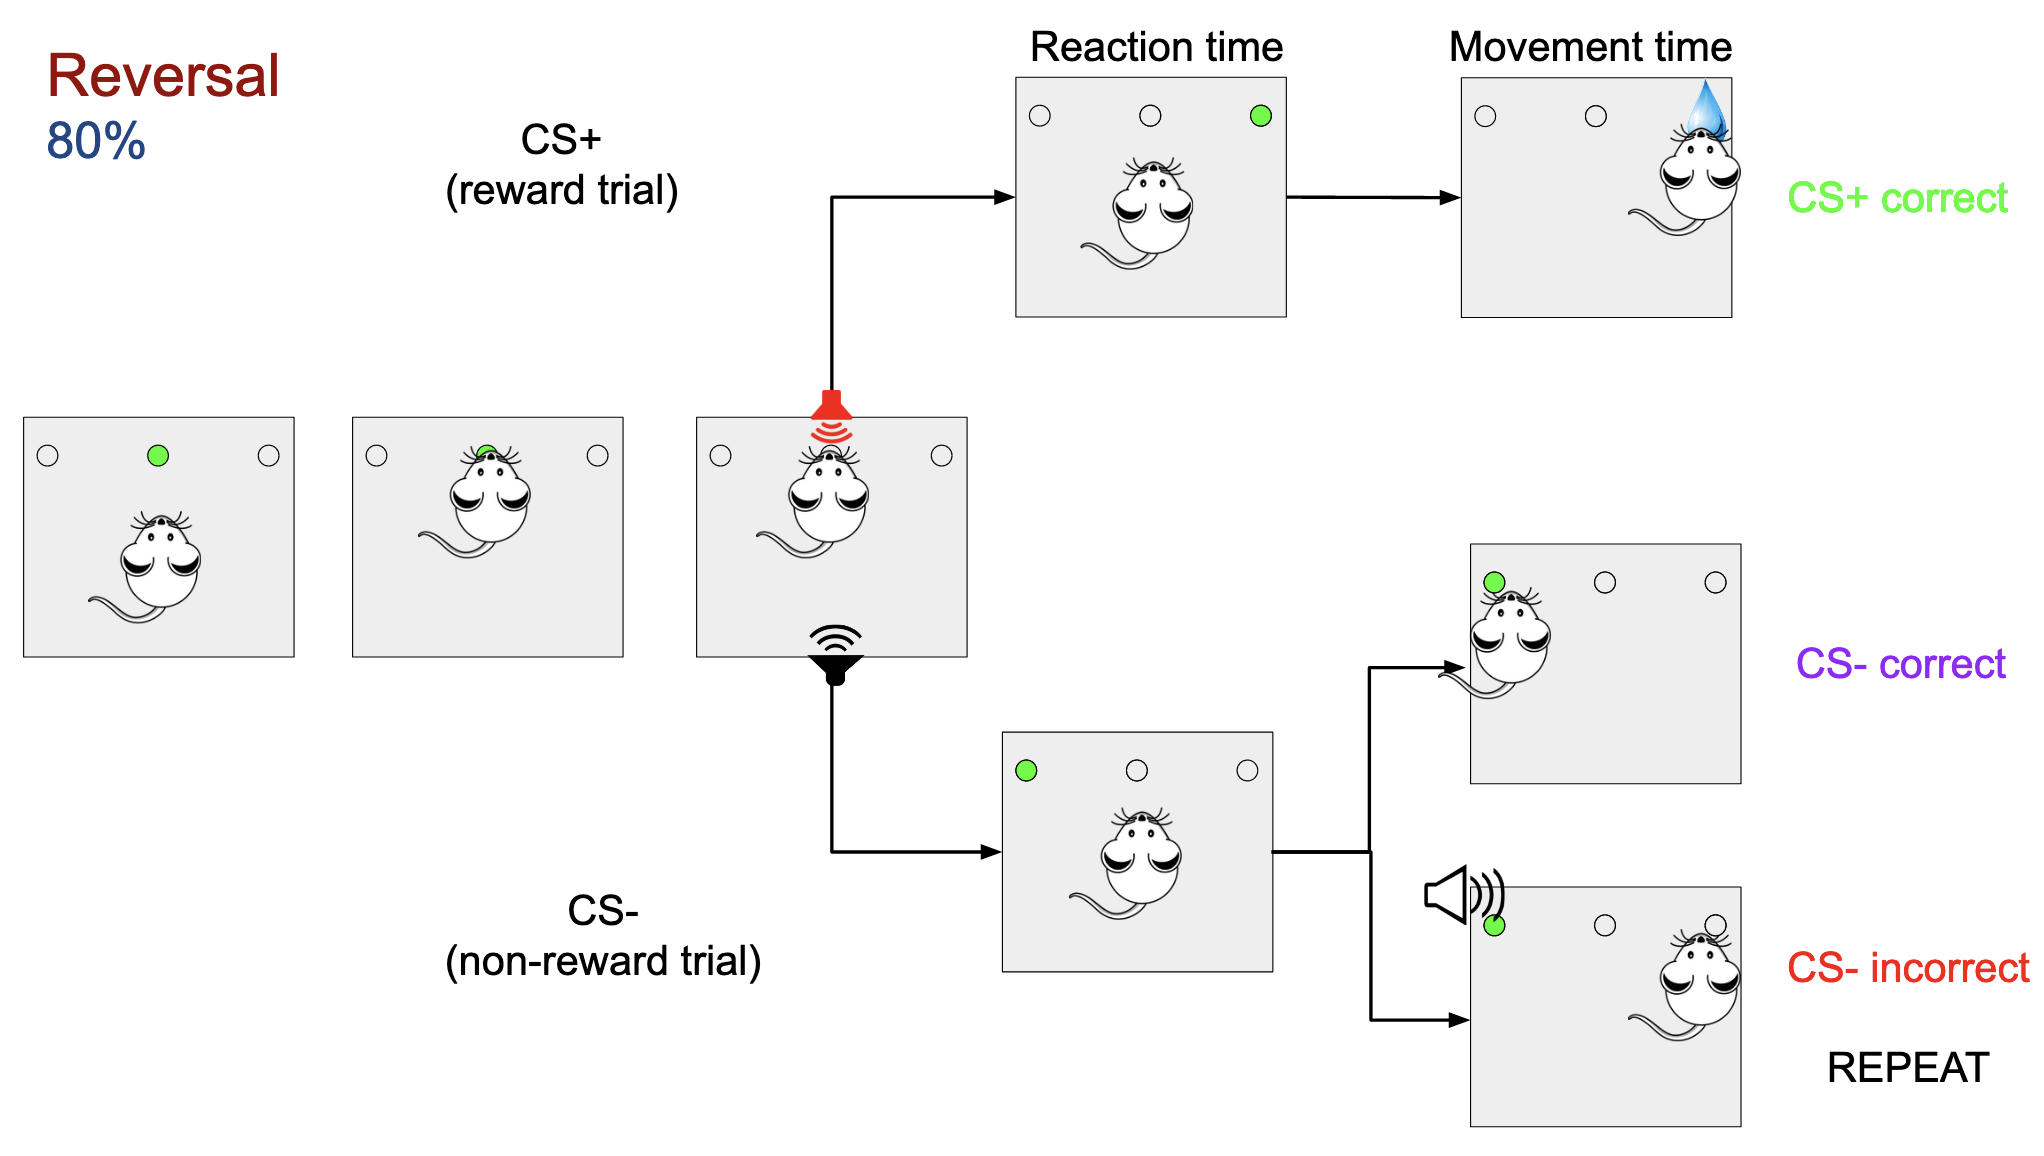
During the reversal learning task, the associated frequencies associated with the type of trial (CS+ and CS-) change, and the rat has to learn this new association, but they are only reversed 80% of the time. The other 20% of the time the associations are the same as in the initial discrimination phase.
In the first part of the project, the learning of the rats is measured by how often they answer correctly to each type of trial. In order to do so, the csv files from the skinner box are pulled and are summarized into two plots. The first one shows the percentage of correct answers in the first try for each trial. The second one shows how many trials are required for that type of trial to make the correct choice. In both cases the values are averaged by using a moving average over 50 elements for smoothing.

---------------------------------------------------
To reproduce these results in the folder '1_BEHAVIOUR', there's a file called RUNME.m. Running that file in matlab will produce the plots seen in the previous image.
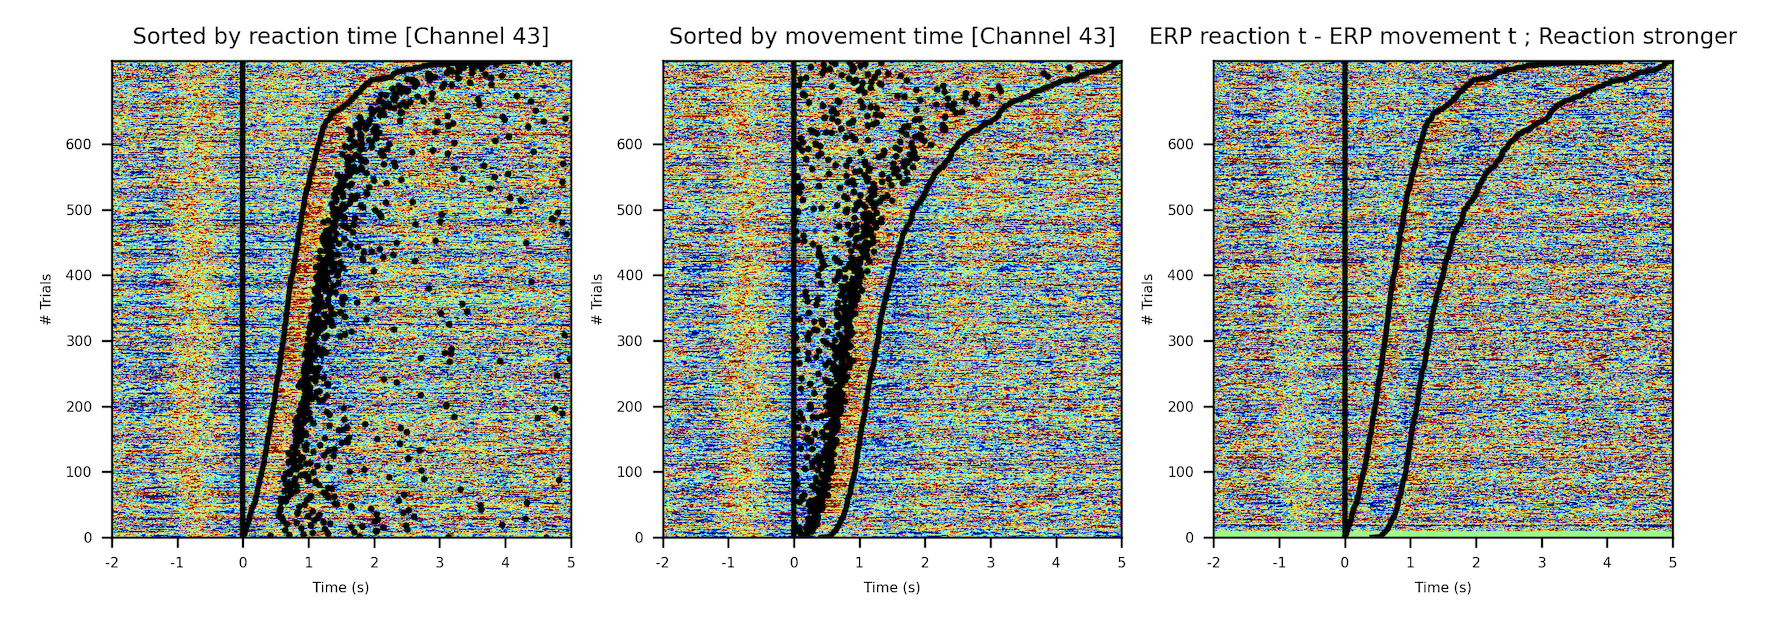
To check whether the task has a direct effect and produces a spike on the neural activity, we used Event Related Potentials (ERPs). The voltage measured is plotted as a heat map, all trials are plotted stacked vertically, with the time ascending as we move to the right, and as we move up, the reaction time (when the rat takes off its nose of the hole) or the movement time (when the rat puts the nose on one of the side holes) are sorted and they go up as we move up in the plot.
The presence of such a marked activity spike indicates two things. We are probing the right zones. It will be necessary to align the voltage measures with the different events of the trial during time-frequency analysis, so activity that might be masked by the temporal misalignment of some events is uncovered.
---------------------------------------------------
To reproduce these results in the folder '2_ERP', there's a file called RUNME.m. Running that file in matlab will produce the plot seen in the previous image. The script needs the experiments data to run properly. They can be downloaded with the script 'download_data.sh' (1.3GB) from my personal google drive.
After running the matlab script, it might be necessary to run a final python script in the terminal by hand as matlab tends not to run terminal commands properly very often.
The central part of the project, here the voltages measured in a time series have their frequencies extracted using the fourier transforms and morlet wavelets to focus the activity at different frequencies in different ways.
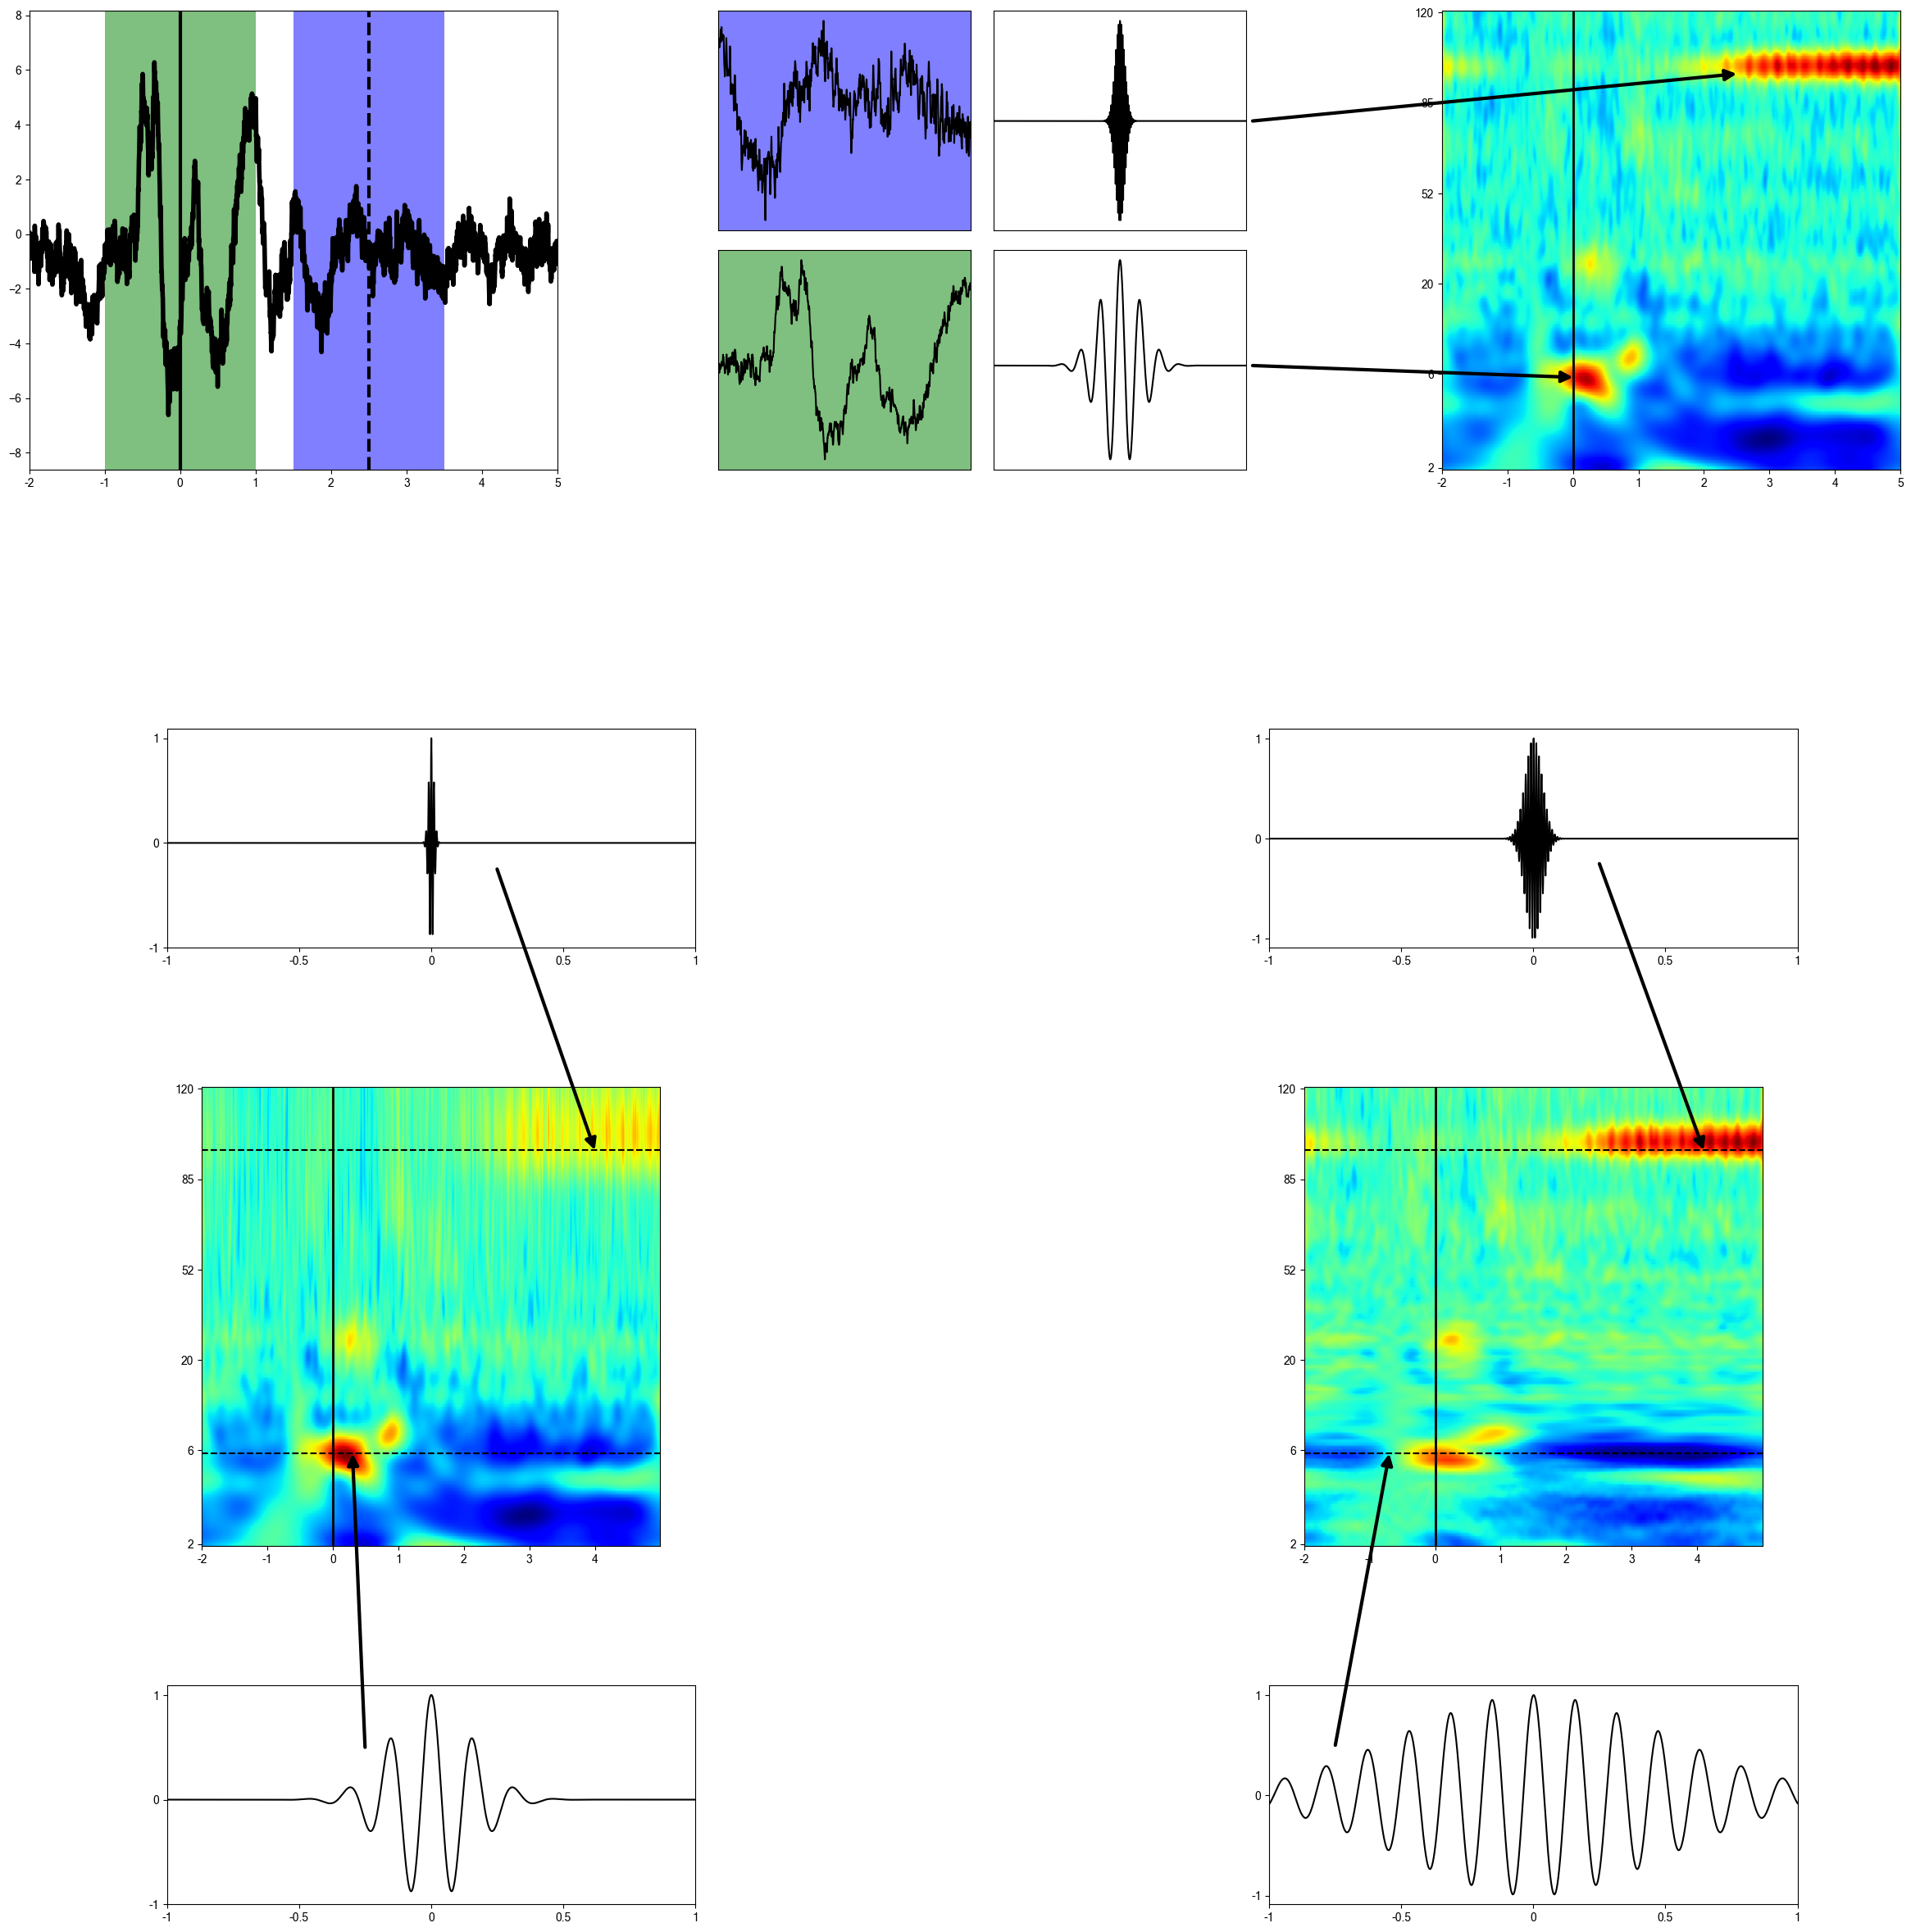
Since most of the power is concentrated in lower frequencies and the frequency bands are more concentrated there, up until 25 Hz a logarithmic scale is used, to examine that region in more detail. From 25 to 120, frequencies are analyzed in a linear manner. A dotted line splits the two regions in the plots.
Each electrode has the fourier analysis performed on its data, and its spectrogram is plotted in an anatomical way so region-wide activity burst can be visualized relative to its spatial position.
As mentioned in the previous section, different centerings are used so activity locked to the mouse removing its head from the hole or moving into the goal hole is uncovered. In total 9 anatomical plots like this should be created:
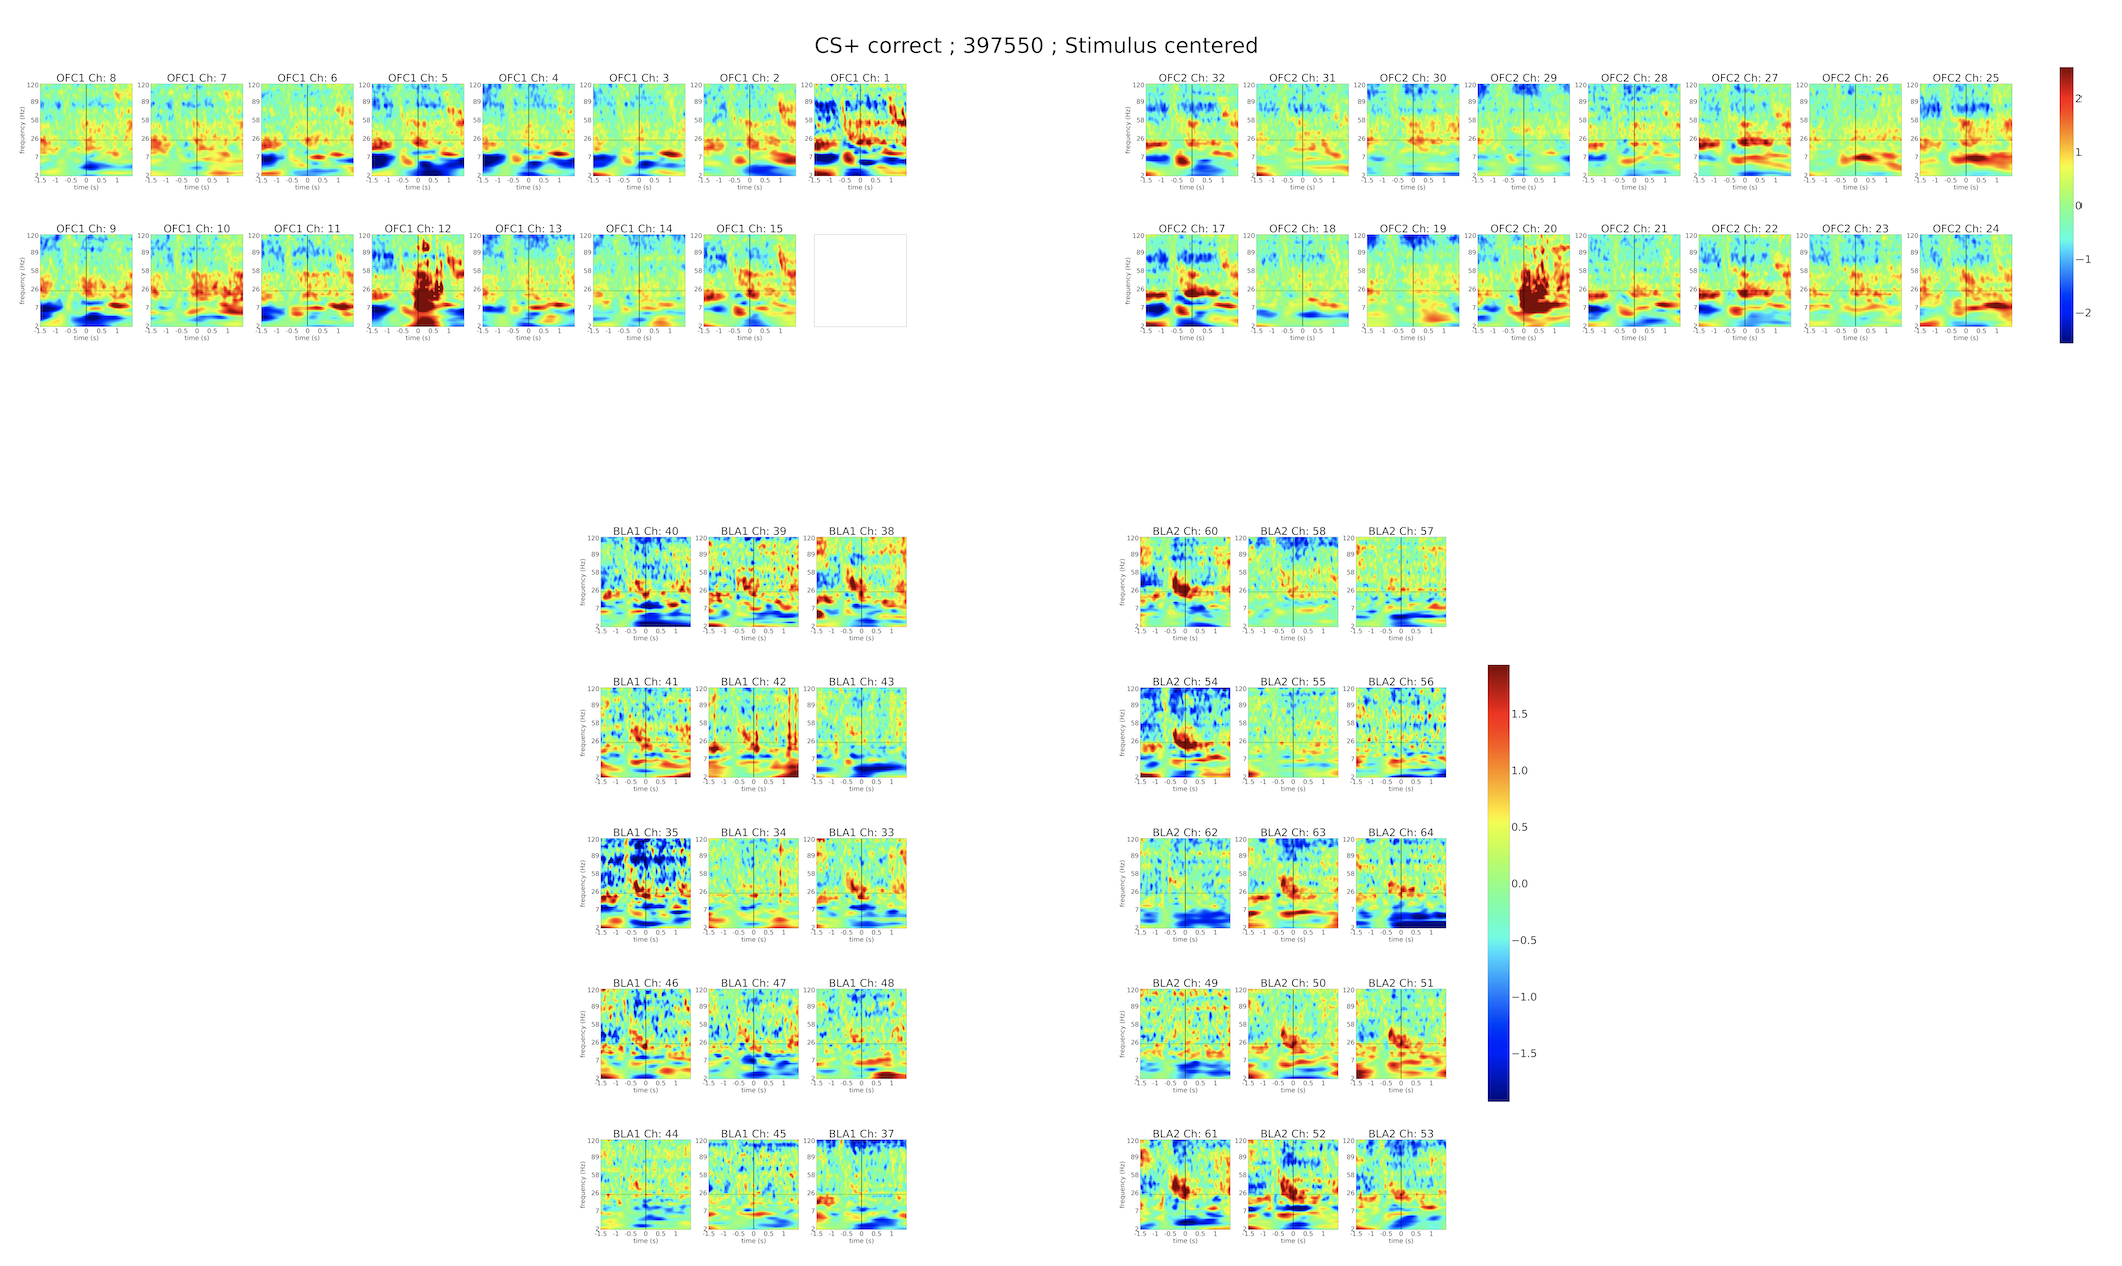
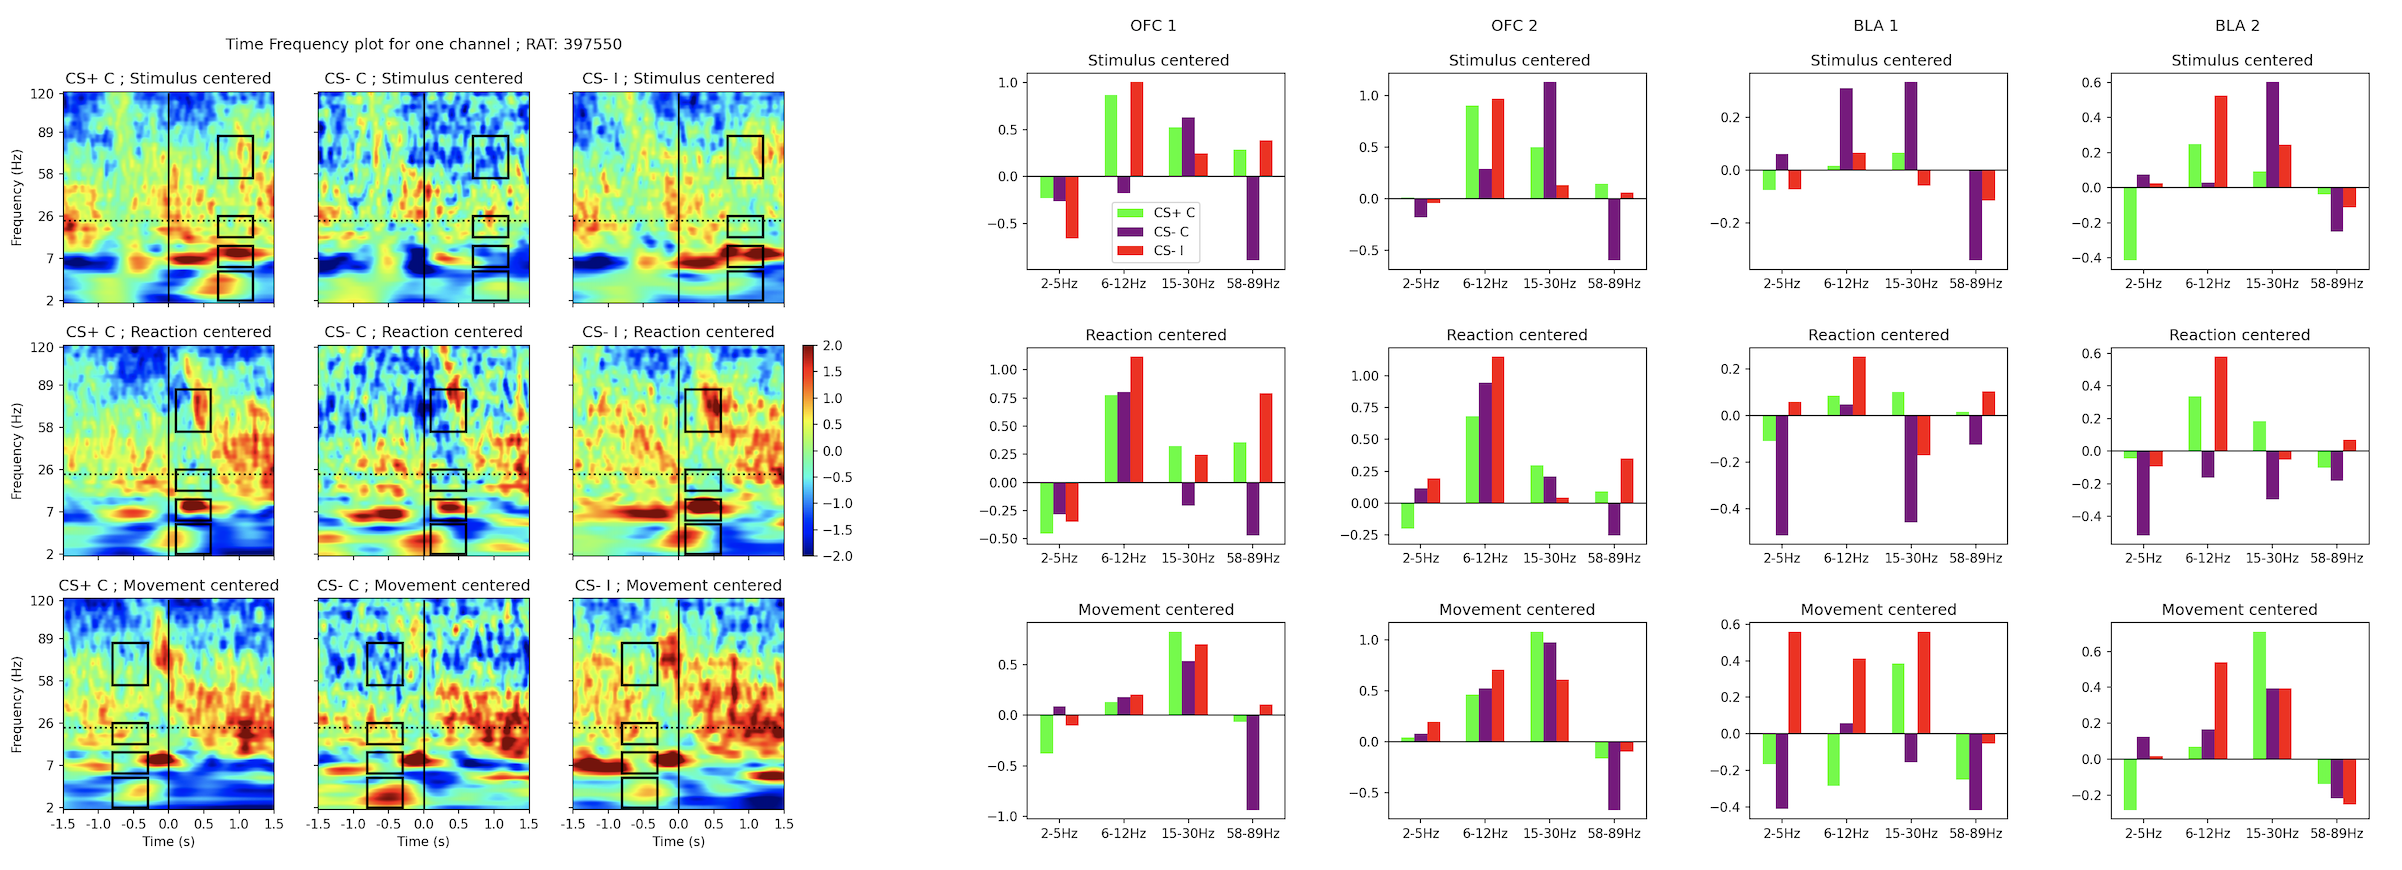
In the final section we look for differences in the power in among conditions. After selecting 4 frequency bands at different moment and centerings we arrive at the conclusion that there's a more than obivious difference between conditions.
The most representative channel for it has its spectrograms shown, but all electrodes are taken into account.
---------------------------------------------------
To reproduce these results and the ones in section 3, in the folder '3_TF', there's a file called RUNME.m. Running that file in matlab will produce 9 plots similar as the one seen in the previous section and the one seen in this section. The script needs the experiments data to run properly. They can be downloaded with the script 'download_data.sh' (1.3GB) from my personal google drive. Running these two sections can take around 10-12 hours (MBP 16" 2019, Matlab 2019b), so there's the option to download the plots directly by running the 'download_final_topographical_TF_plots.sh' script.
The images are generated with python scripts that might need to be run by hand on the terminal. The final result image from this section is already included in the folder where data and plots for each rat is saved 'Discrimination_397550' (in this case only rat 397550 will be used)