You signed in with another tab or window. Reload to refresh your session.You signed out in another tab or window. Reload to refresh your session.You switched accounts on another tab or window. Reload to refresh your session.Dismiss alert
The data aggregating and plotting code of Galaxy Zoo: 3D
make_subject_fits.py: This code uses the panoptes-python-client to grab and aggregate the classifications for a point drawing workflow, a polygon drawing workflow, and a poly-freehand drawing workflow. All classification data and resulting pixel masks are stored in a .fits file.
The output of the point aggregation is any cluster of points with more than three classifications within 5 pixels of each other (using DBSCAN). The center and 2-sigma extent of each cluster is found and a pixel mask is created for these ellipses.
The output of the polygon and poly-freehand aggregation is a pixel mask a count of the number of classifications that contained that pixel. It also ignores any self-intersecting polygons (as they don't have a well defined "inside").
mpl_style.py: A custom style file for matplotlib
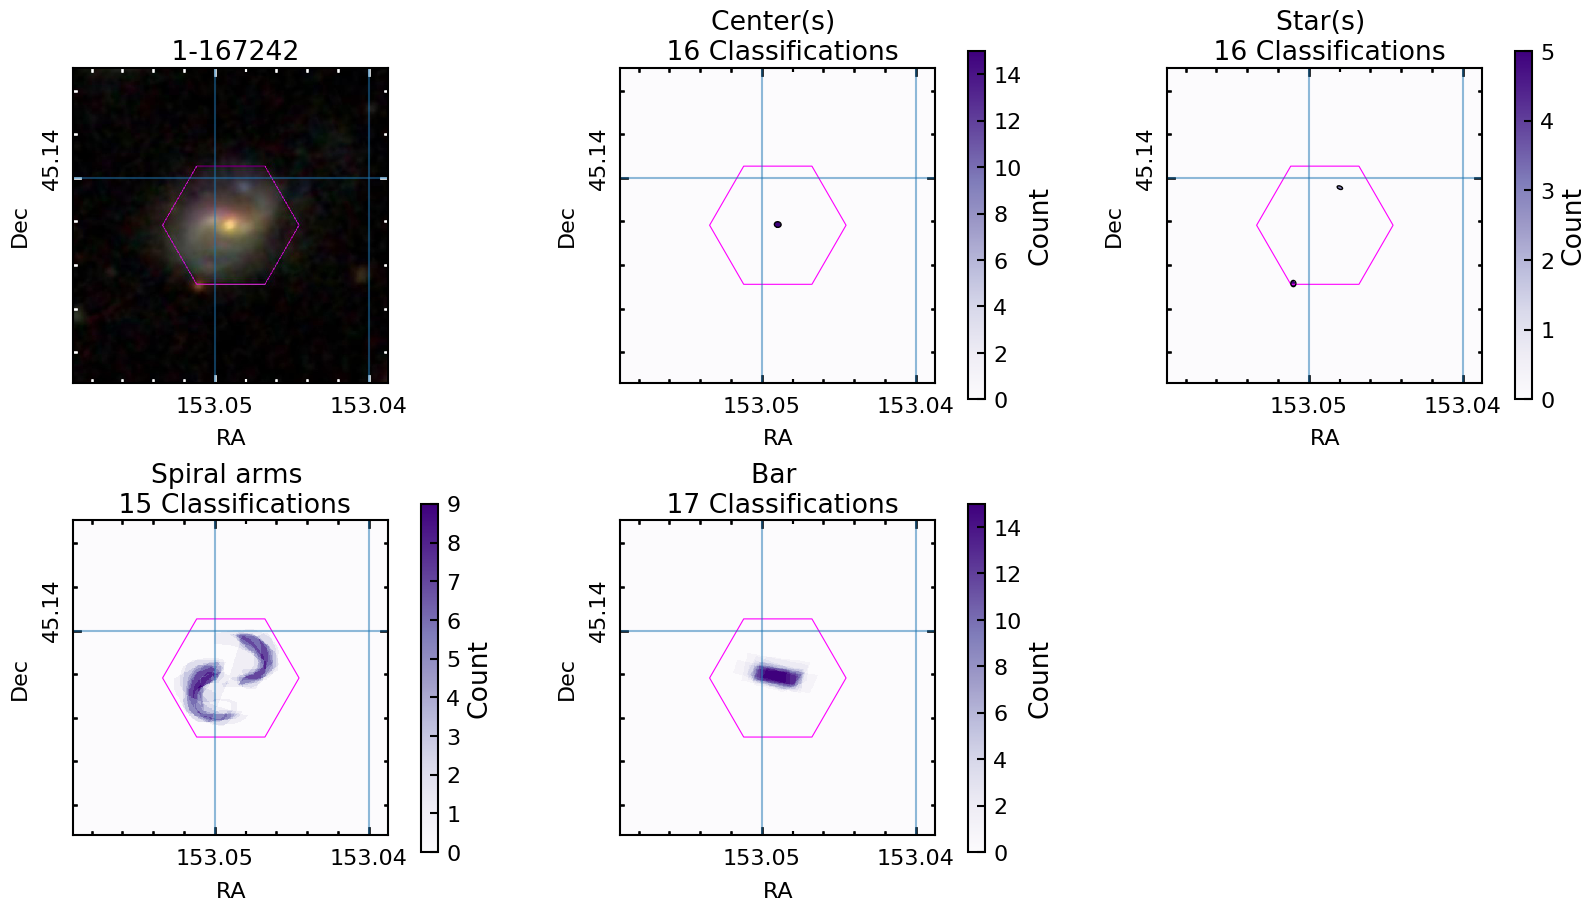
plot_fits_files.py: This code takes the .fits files created above and makes plots showing the various pixel masks