
Replies: 2 comments 1 reply

|
Show your code |
1 reply

|
I edited the original post. |

Sign up for free
to join this conversation on GitHub.
Already have an account?
Sign in to comment


Uh oh!
There was an error while loading. Please reload this page.
Uh oh!
There was an error while loading. Please reload this page.
I was trying to create a lineseries chart with Double charted against a DateTime. I saw the default type "DateTimePoint" and tried to use it. It works when the differences in time are in the range of days down to a few hours. But when I was trying to graph in the minutes range the points just stacked on top of each other in a straight up and down line. Is there a way to fix this? Should I be using a different type?
I had 6 points between jan 1 2021 at 1am - jan 1 2021 at 2am and they plotted like this:
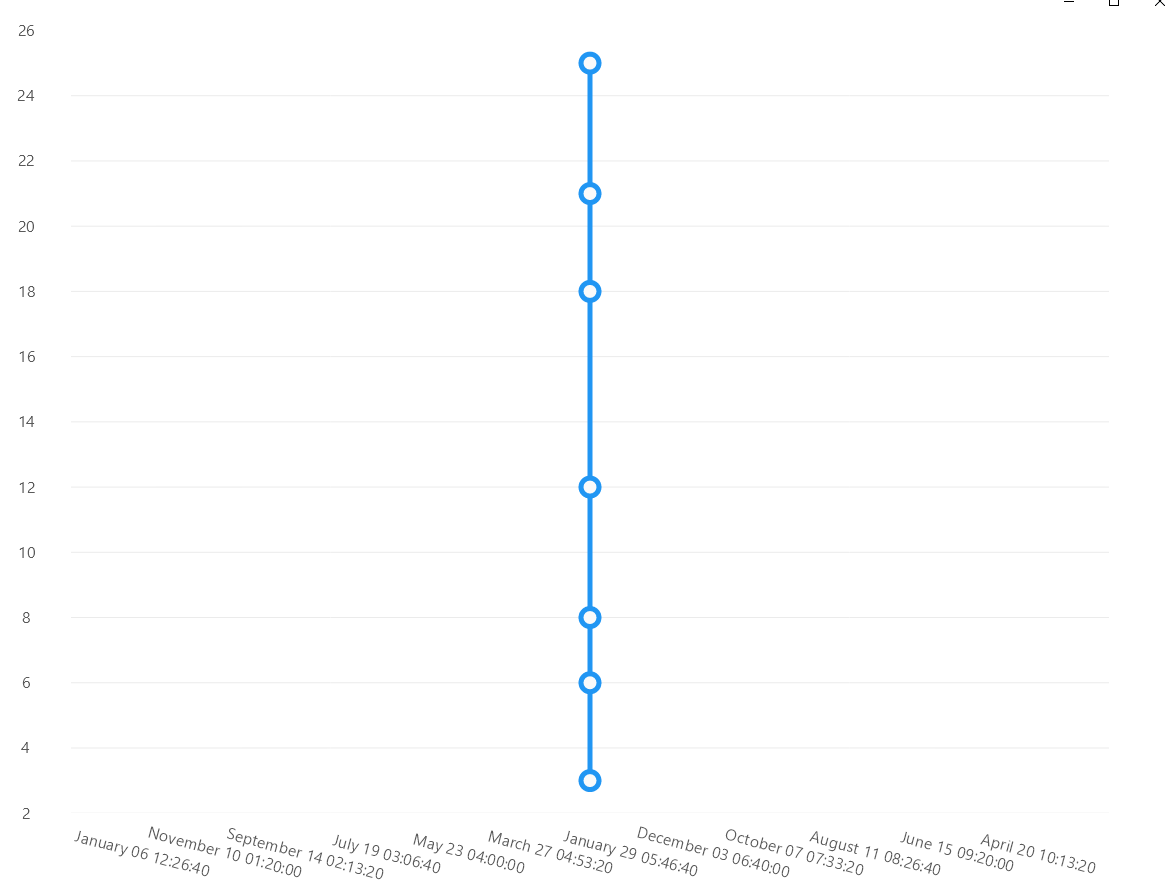
I've figured out that it is most likely caused by the x value DateTime loosing part of its data because the SecondaryValue it is added to is a float with not enough room for the data.
Code:
All reactions