The zip folder contains files of the project description, given data, and my completed code (medical_data_visualizer.py). Note: The code might run better in the Repl environment. Here is a link to my original Repl: https://replit.com/@MarcoAgudo/boilerplate-medical-data-visualizer-Final
Create a catplot and heatmap as well as make calculations based on medical examination data using Matplotlib, Seaborn, and Pandas.
In this project, you will visualize and make calculations from medical examination data using matplotlib, seaborn, and pandas. The dataset values were collected during medical examinations.
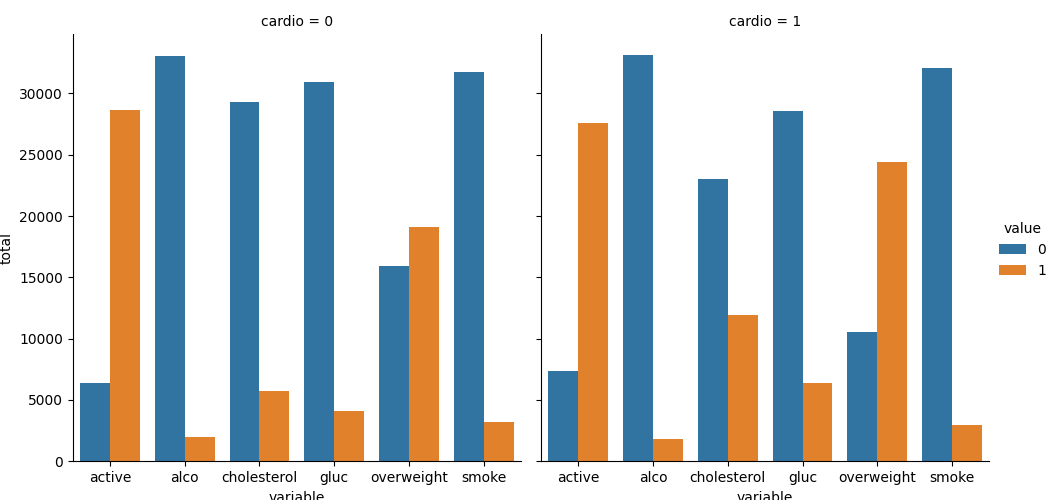
Cardio = 1 or 0: Presence or absence of cardiovascular disease Value = 1 or 0: High or Normal compartive value OR Yes or No for respective column, ex. gluc = 0 (normal glucose level) gluc = 1 (high glucose level), active = 1 (exercises) active = 0 (inactive)
An interesting trend found in both graphs Cardio = 0 and Cardio = 1 is that the presence or absence of cardiovascular disease does not affect the distributions for each column. This would mean that the habits and health of each population (active/inactive, overweight/normal weight, with high/low glucose, high/low cholesterol, non/alcohol drinkers, and non/smokers) are not dramatically affected by cardiovascular diseases compared to those not affected. The only outstanding difference between those with cardiovascular diseases and those without is that those with cardiovascular disease have higher cholesterol and are more likely to be overweight compared to their counterparts without cardiovascular diseases.
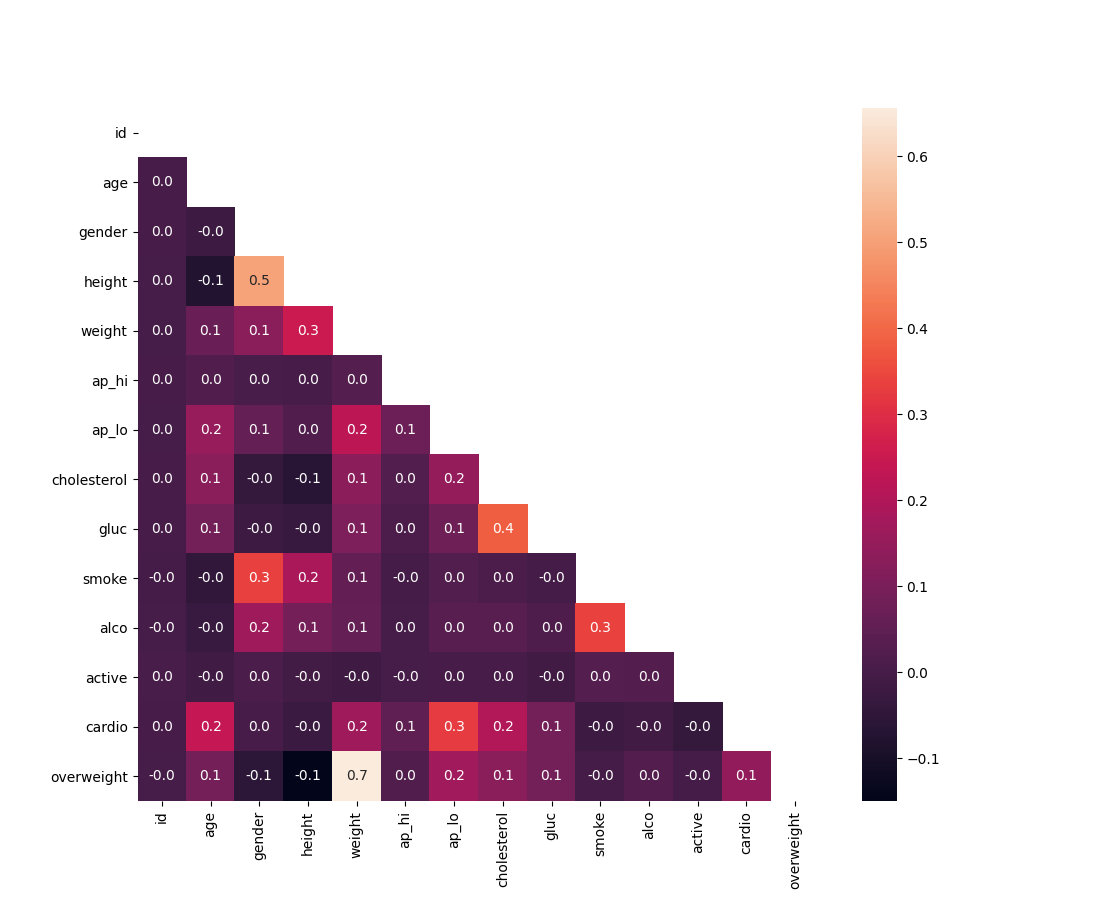
This heat map provides deeper insight into the correlation between the health and habit indicators. The strongest correlations found based on the heat map are:
- glucose and weight
- gender and height
- ap_lo and cardio
- gender and smoking
- smoking and alcohol
Suprisingly excercise does not have any correlation with any other features, meaning excercise does not have any strong correlation with any unhealthy or unhealthy feature.
Below is a graph providing an explanation for each feature.
| Feature | Variable Type | Variable | Value Type |
|---|---|---|---|
| Age | Objective Feature | age | int (days) |
| Height | Objective Feature | height | int (cm) |
| Weight | Objective Feature | weight | float (kg) |
| Gender | Objective Feature | gender | categorical code |
| Systolic blood pressure | Examination Feature | ap_hi | int |
| Diastolic blood pressure | Examination Feature | ap_lo | int |
| Cholesterol | Examination Feature | cholesterol | 1: normal, 2: above normal, 3: well above normal |
| Glucose | Examination Feature | gluc | 1: normal, 2: above normal, 3: well above normal |
| Smoking | Subjective Feature | smoke | binary |
| Alcohol intake | Subjective Feature | alco | binary |
| Physical activity | Subjective Feature | active | binary |
| Presence or absence of cardiovascular disease | Target Variable | cardio | binary |