Performing analysis on Kickstarter data to learn how campaigns fare in relation to their launch dates and funding goals.
To give our client analytical insight on the campaign data and how certain variables effect one another, if at all.
Using Microsoft Excel, Kickstarter data was sorted by various variables including launch dates, campaign outcomes, funding goal amounts, and pledged amounts, just to name a few.
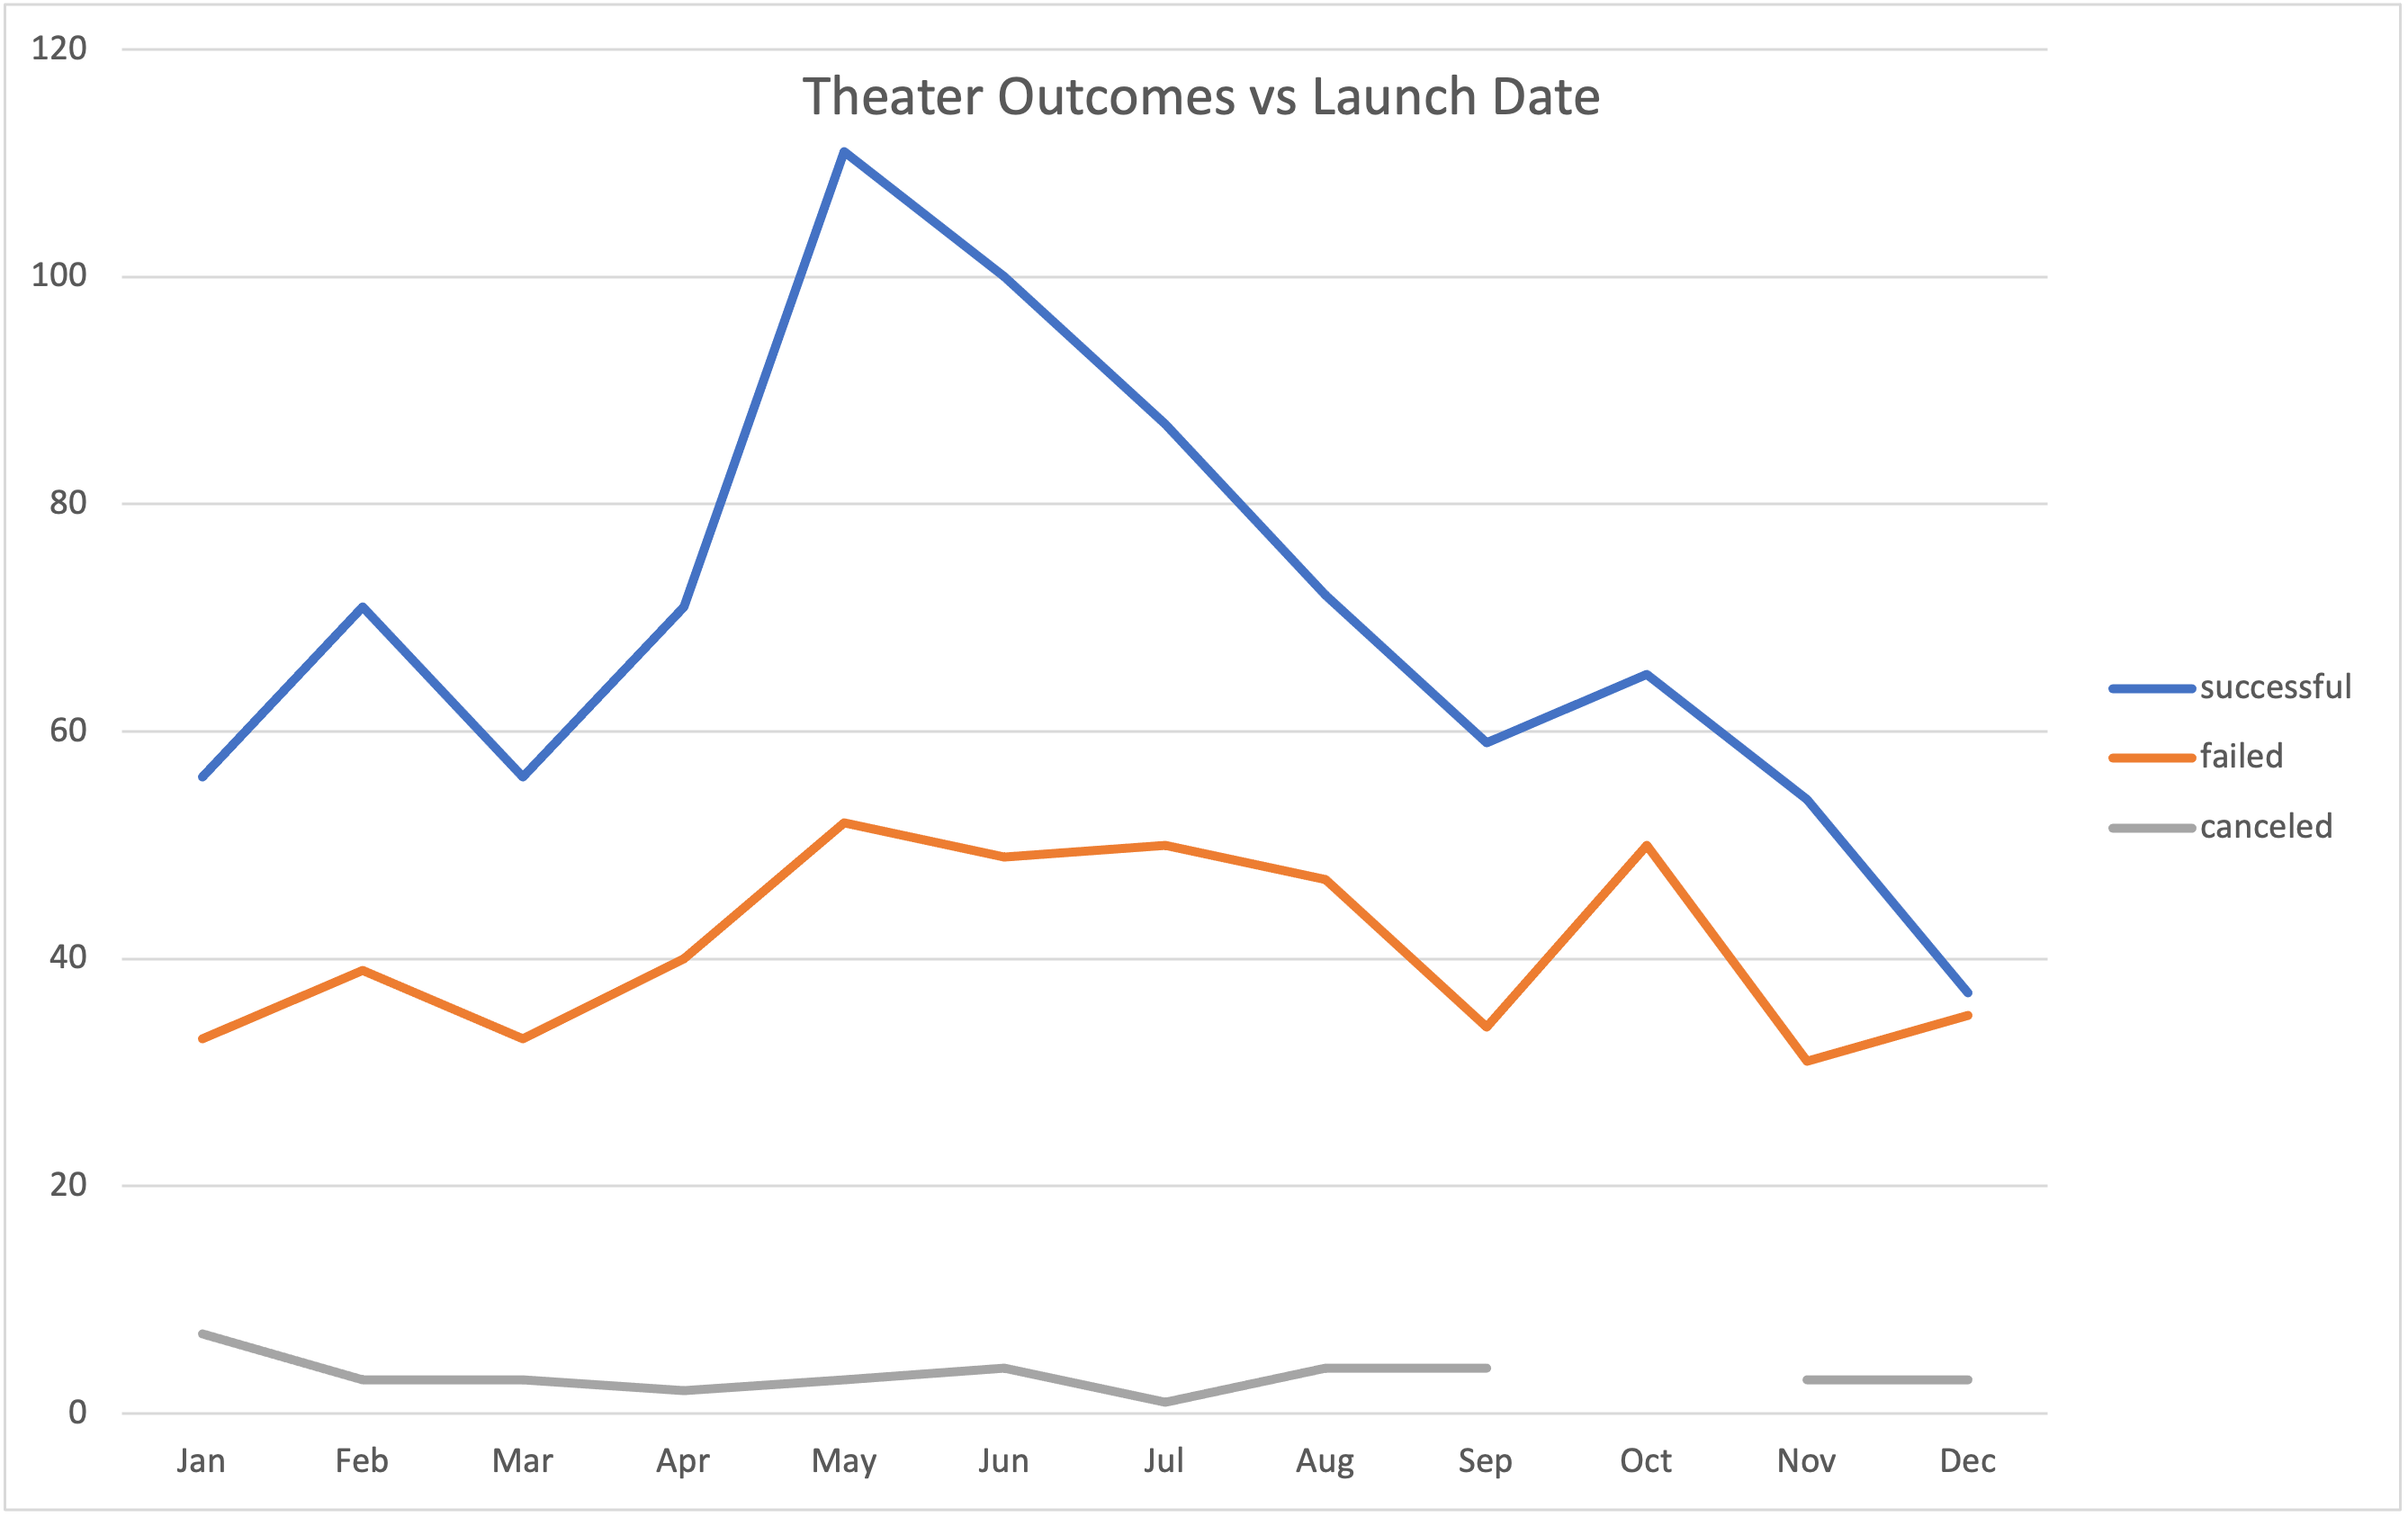
Data was extracted from the data set and filtered for campaigns having to do with theater as a category. Next, Unix timestamps were converted to Month/Day/Year to find out exactly when the campaign was started. A pivot table was then created to test for correlation between launch date and campaign outcomes. Finally a graph was created from the pivot chart to visualize the results. A line graph was chosen to best represent the data.
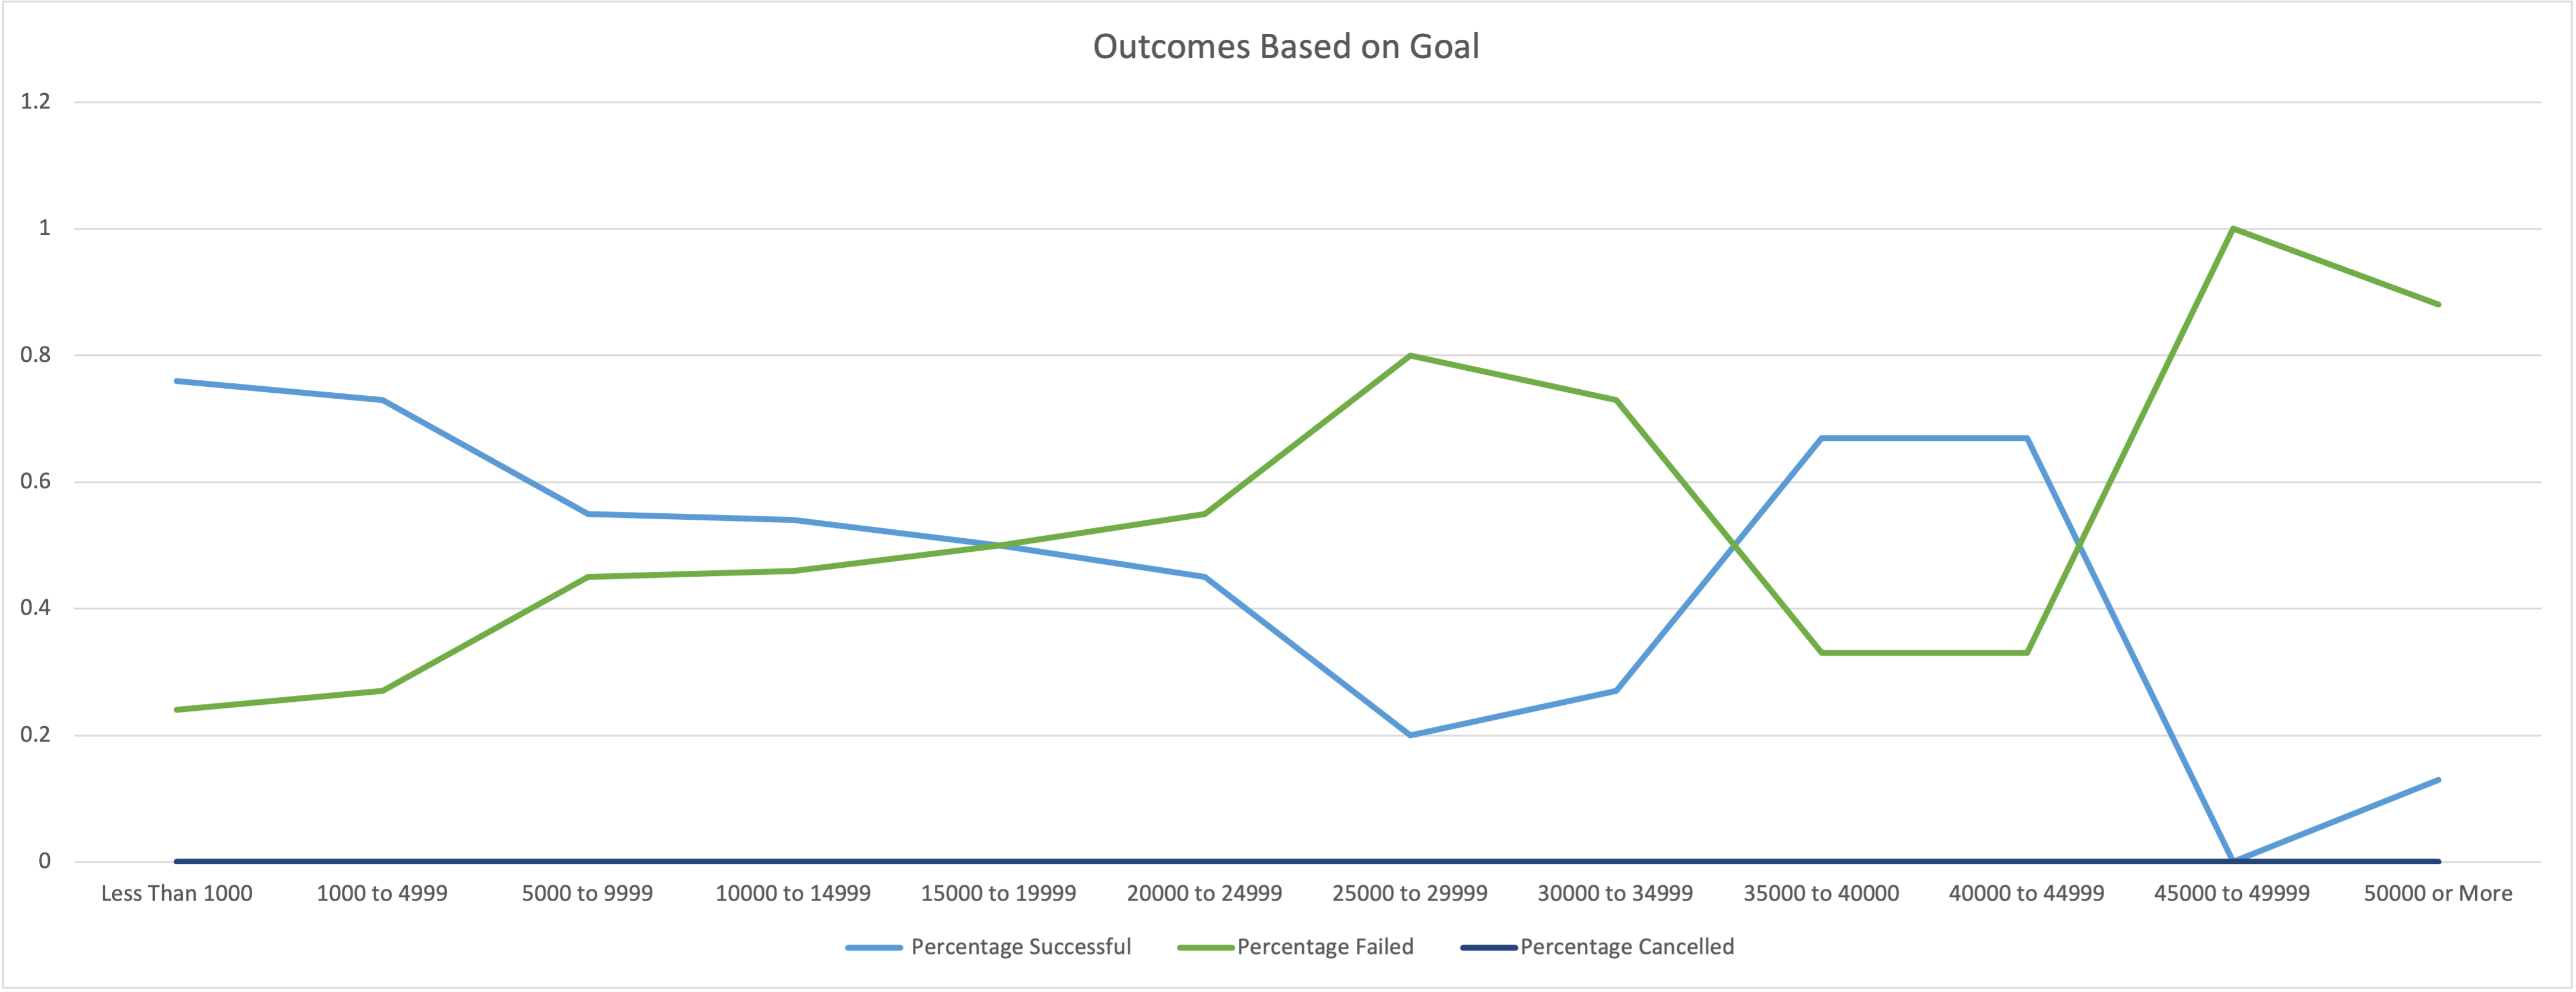
Like the analysis for outcomes based on launch dates, data was extracted from the data set and filtered for campaigns having to with theater as a category and further filtered for a subcategory of "plays". Some theater projects may be real estate in nature and that may require much larger goals that may skew the results in the high range, so they were filtered out. The majority of goals were then divided in increments of five thousand dollars, except the first two ($1000, or less, and $1000 to $4999 respectively) and the last (anything over $50K). A line graph was created to represent the success rate based on the goals and a bar chart was created to represent total projects based on their respective ranges to highlight the 92% cluster of data being within the $1 and $15,000 range.
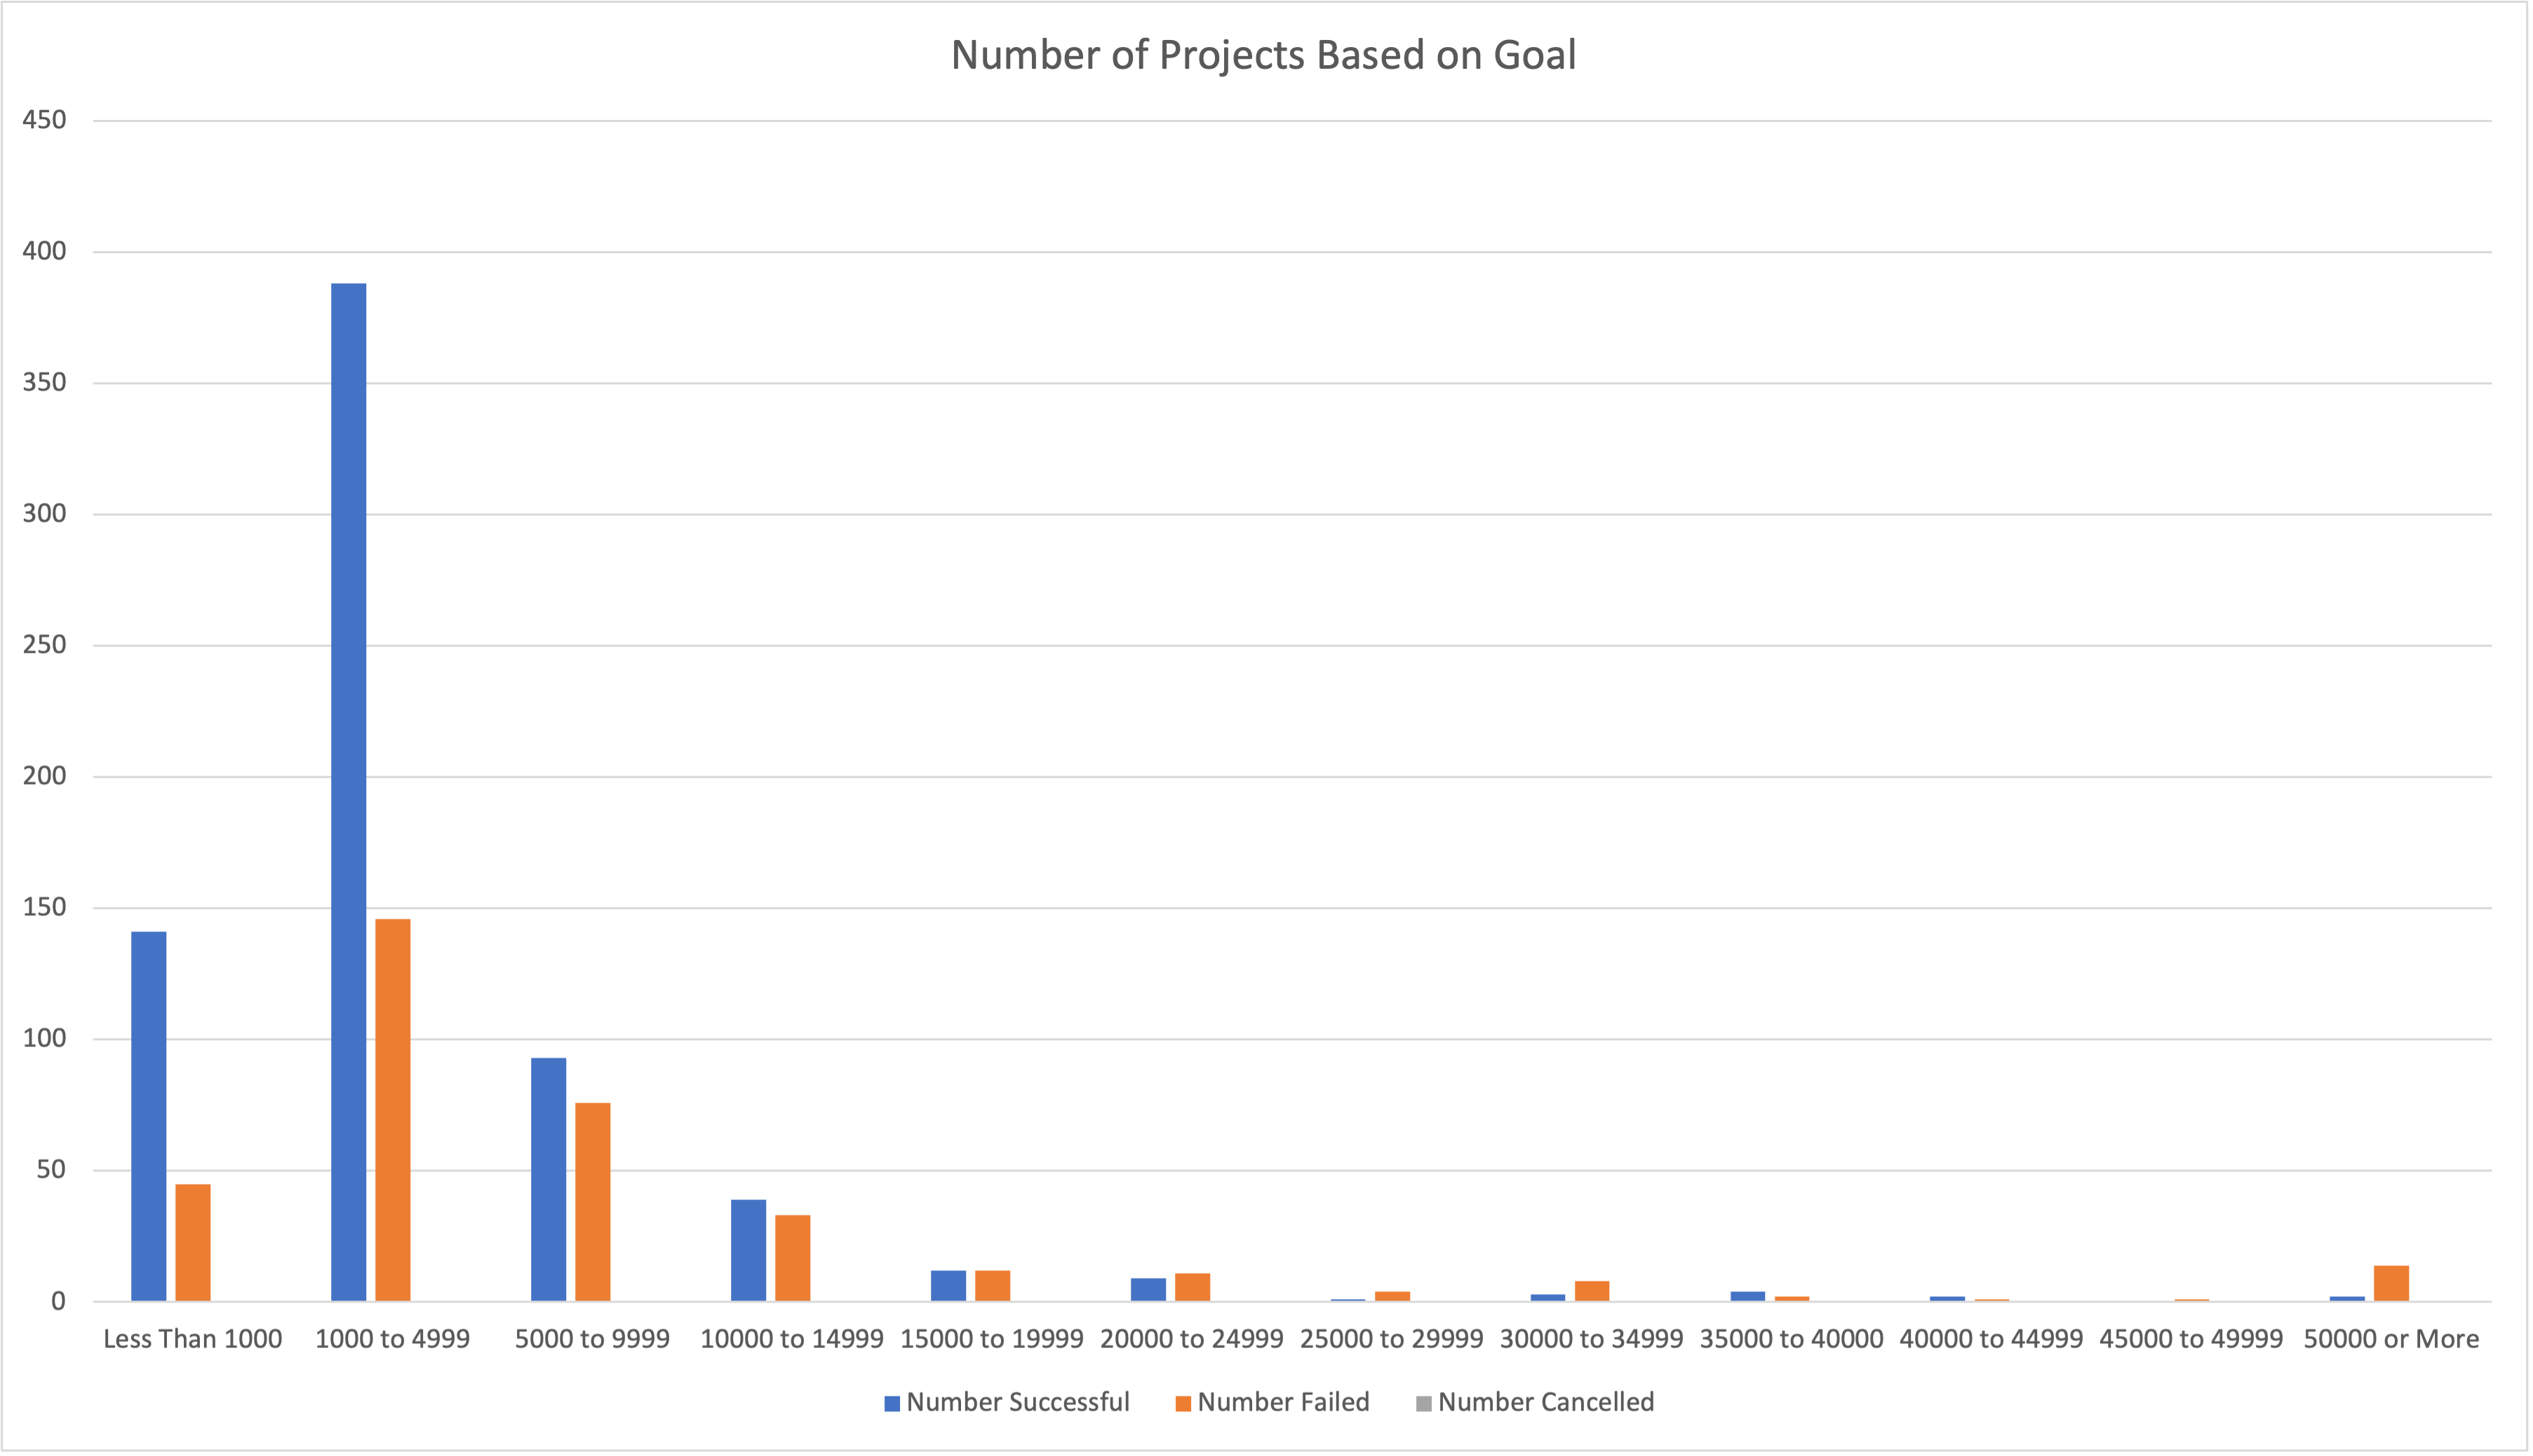
One challenge encountered during the project was trying to visualize the conclusion I wanted to convey based on the rubric given. Ultimately I decided adding a bar chart would paint a clearer picture.
From an analysis solely based on how theater campaigns fared in relation to their launch dates, one can conclude that there is a precise window in which an individual can find increased chances of success in their theatrical endeavors with respect to a Kickstarter campaign. By timing their launch date between early spring to mid summer, they can increase their odds of a successful campaign given the large spike of successful campaigns that start in this time period (shown in the firsr chart) and the proportion of success in relation to those that failed. Given the nature of the curves of each line, it is apparent that there is a positive relationship between the two outcomes, meaning that launch dates impact whether you will find success or not in the same way, except for the months of November and December where the curves have a negative relationship. It is inadvisable to attempt a launch in either of these months as the chances for success decrease, while those of failure increase.
From an analysis solely based on how theater campaigns fared in relation to their funding goals, one can conclude that there is a direct relationship between goal amounts and success rates. Unlike the analysis above where both success and failures spiked up in March, albeit to a much lesser extent for failures, their is a direct correlation between how high you set your goal and the chance you would find success in that bracket, shown through the negative relationship of the curves. By sorting the data into intervals of five thousand dollars, it becomes evident that low goals (below $5000.00) have high rates of success for theater campaigns in relation to those that have failed. With 92% of our data coming in the range of one to fifteen thousand dollars (more clearly defined by the bar chart), it becomes apparent that the higher your goal, the less likely you will find success in a theater campaign on Kickstarter. It is inadvisable to pursue Kickstarter campaigns in excess of fifteen thousand dollars. (Note: The large interchange visible on the high side of the spectrum of the line graph is a small sample size of nine projects.)
One piece of information that may give clarity to the data is how many of these theater campaigns relied solely on Kickstarter funding or whether they were able to secure funding from other sources and whether that had any effect on success rates. It's possible that successful campaigns that set small goals already had the majority of their needs taken care of and the remainder would have been for non-essential things.
Another important piece of information that may effect funding is the popularity of the producer/product. It's possible that they may have had success with a previous play or they have ties to the community and were able to easily raise the funds through those influences.
Deeper analysis can be done on the Outcomes vs Goals by seeing how much was pledged and whether the failures were indeed from lack of meeting goals or for other reasons.
Also, data can be further filtered by country to see if region has anything to do with success rates and theater campaigns.