Repository navigation
Analysis
The Analysis tab looks at your power across all rides of the active rider. Choose the period at the top: the last 6 weeks, 90 days, 12 months or all time. Per kilogram shows power in W/kg. Hover over any chart to read off values.
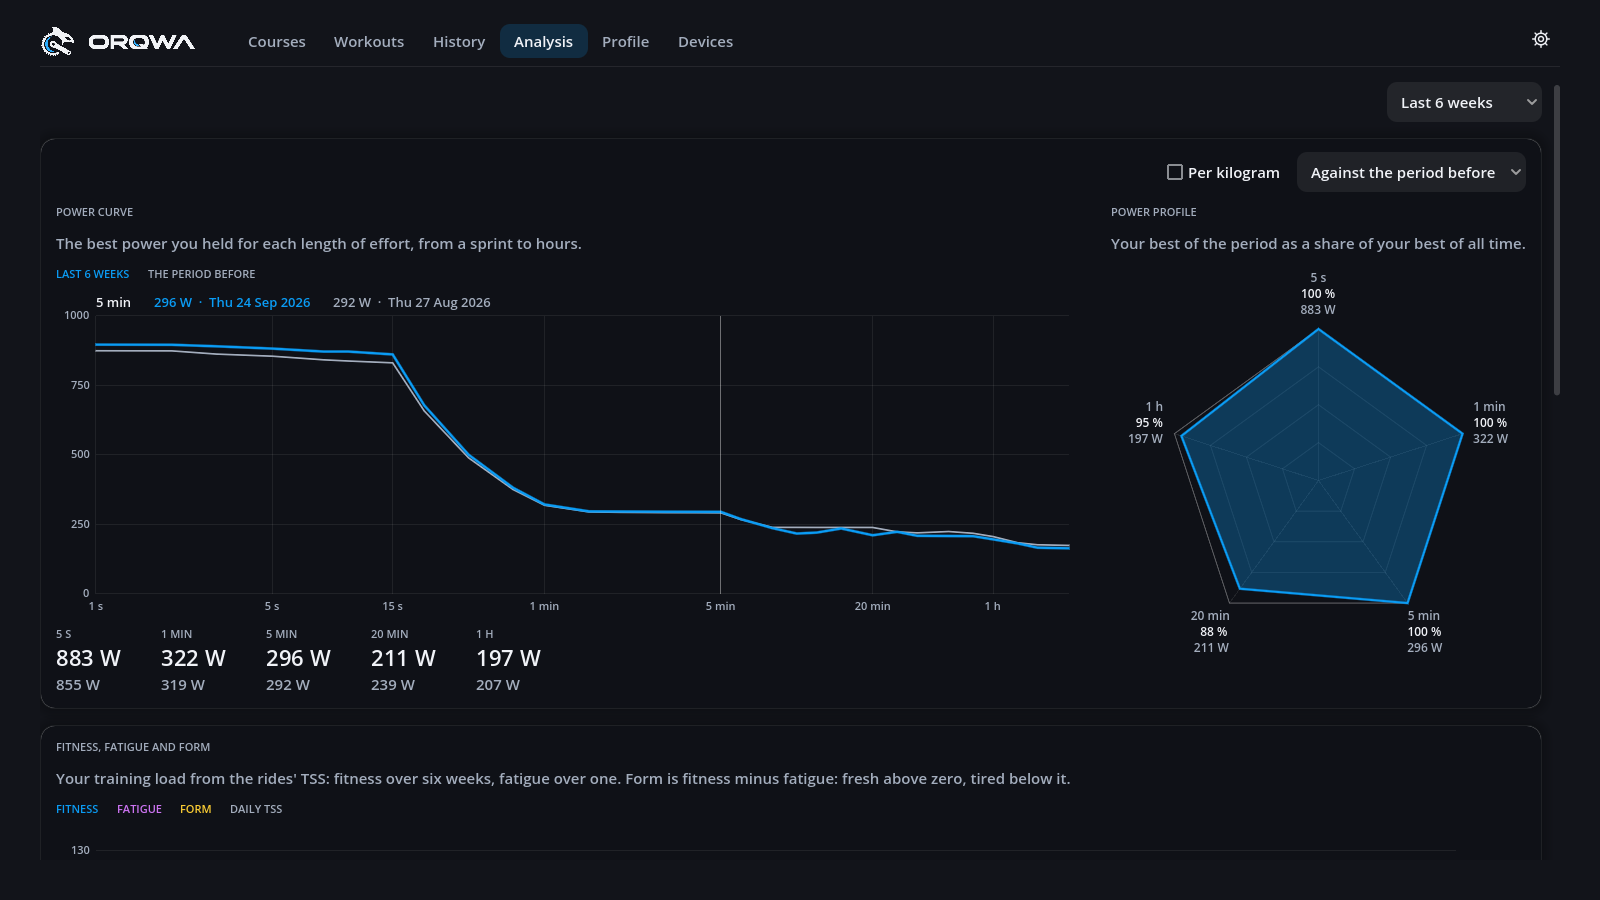
The power curve (blue) shows the best power you held for every duration in the period, against your all-time best or the period before (grey). Where blue meets grey, you are as strong as ever.
The power profile beside it compares your best 5 s, 1, 5, 20 and 60 minutes with your all-time best. A dent shows where there is most to win back.
Simulated rides with the fake trainer don't count.
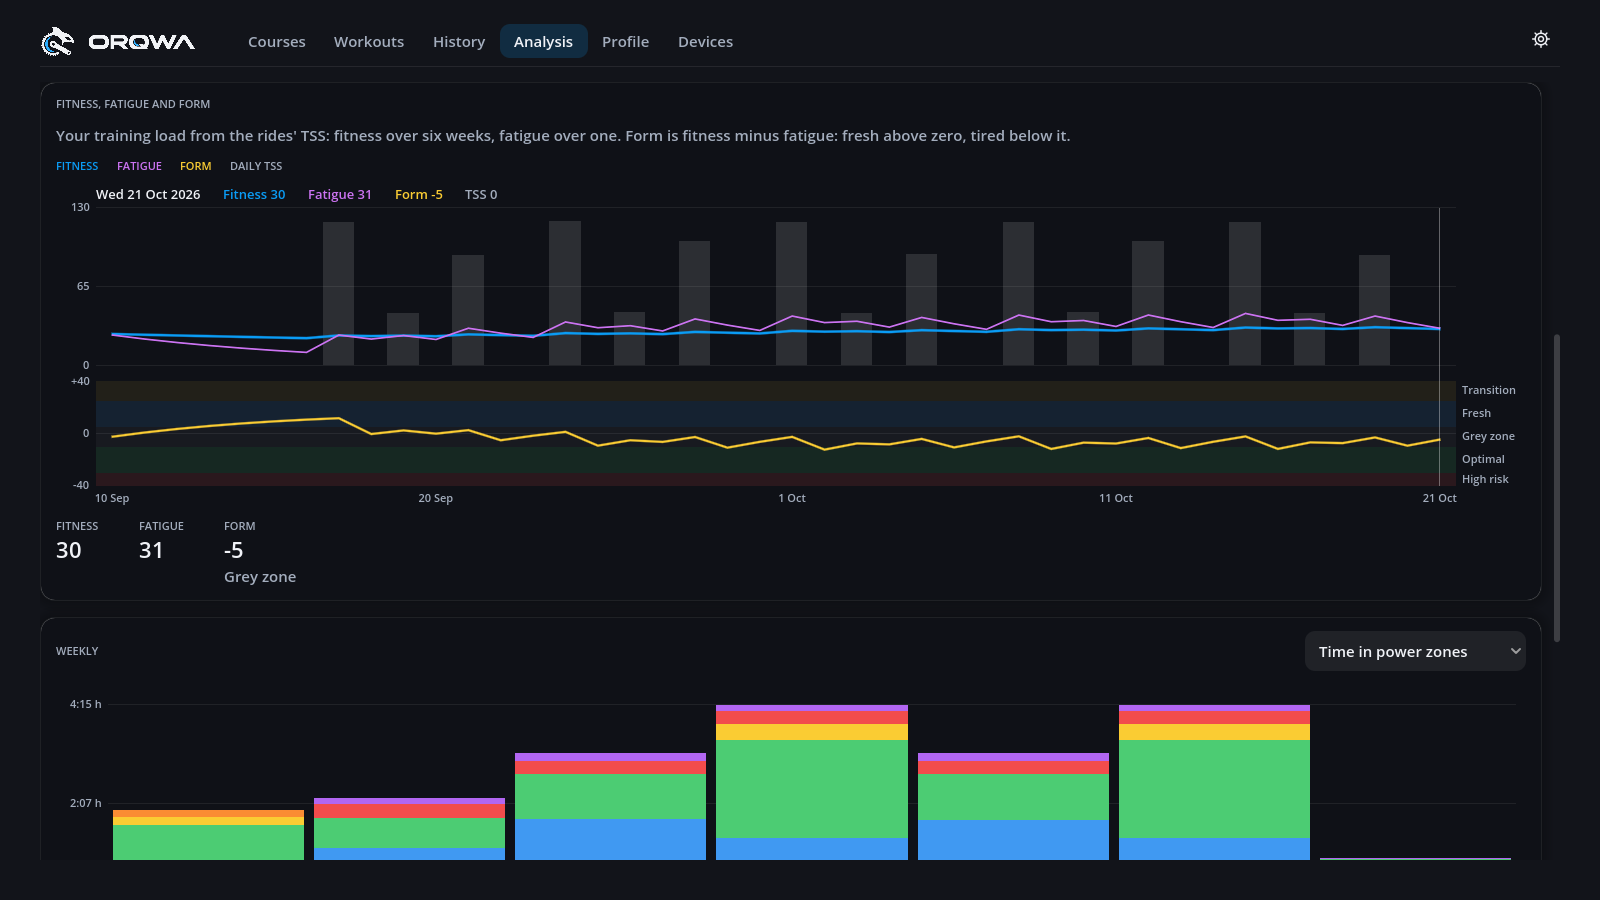
| Line | Meaning |
|---|---|
| Fitness (blue) | Your training load over about six weeks |
| Fatigue (purple) | Your training load over about one week |
| Form (yellow) | Fitness minus fatigue: above zero fresh, below zero tired |
| Form | Means |
|---|---|
| over +25 | Transition: rested, losing fitness |
| +5 to +25 | Fresh: ready to race |
| −10 to +5 | Grey zone |
| −30 to −10 | Optimal: training that builds fitness |
| under −30 | High risk |
Everything starts at zero with your first ride, so fitness says little in the first weeks.
Bars per week for riding time, distance, climbing, TSS, number of rides, or time in power or heart-rate zones.
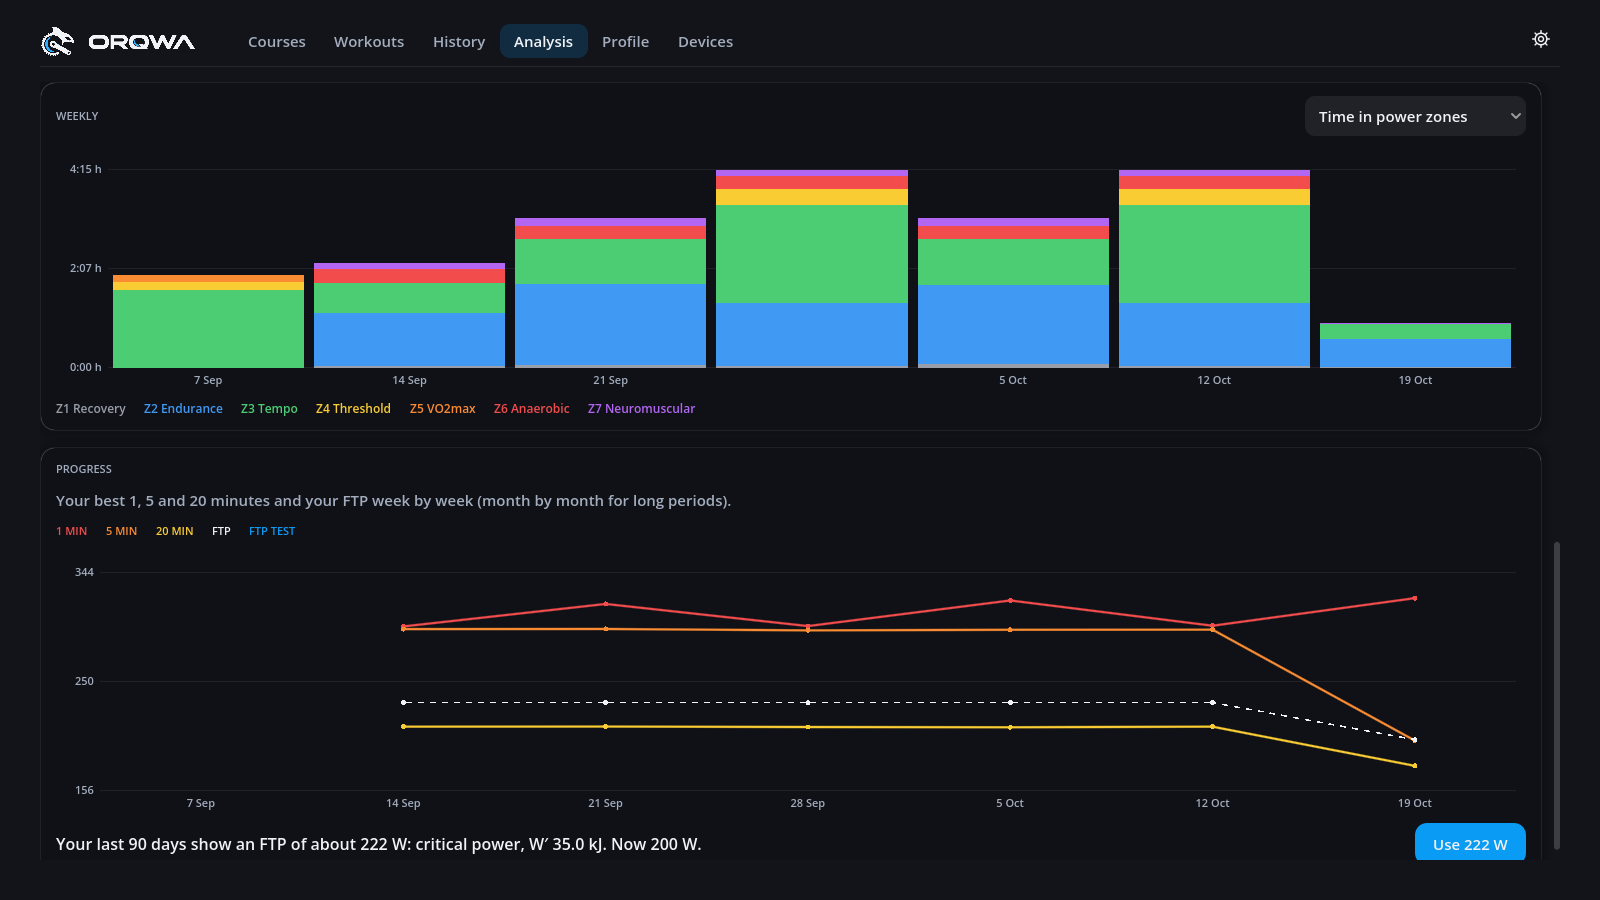
Your best 1, 5 and 20 minutes week by week, with your FTP and FTP test results.
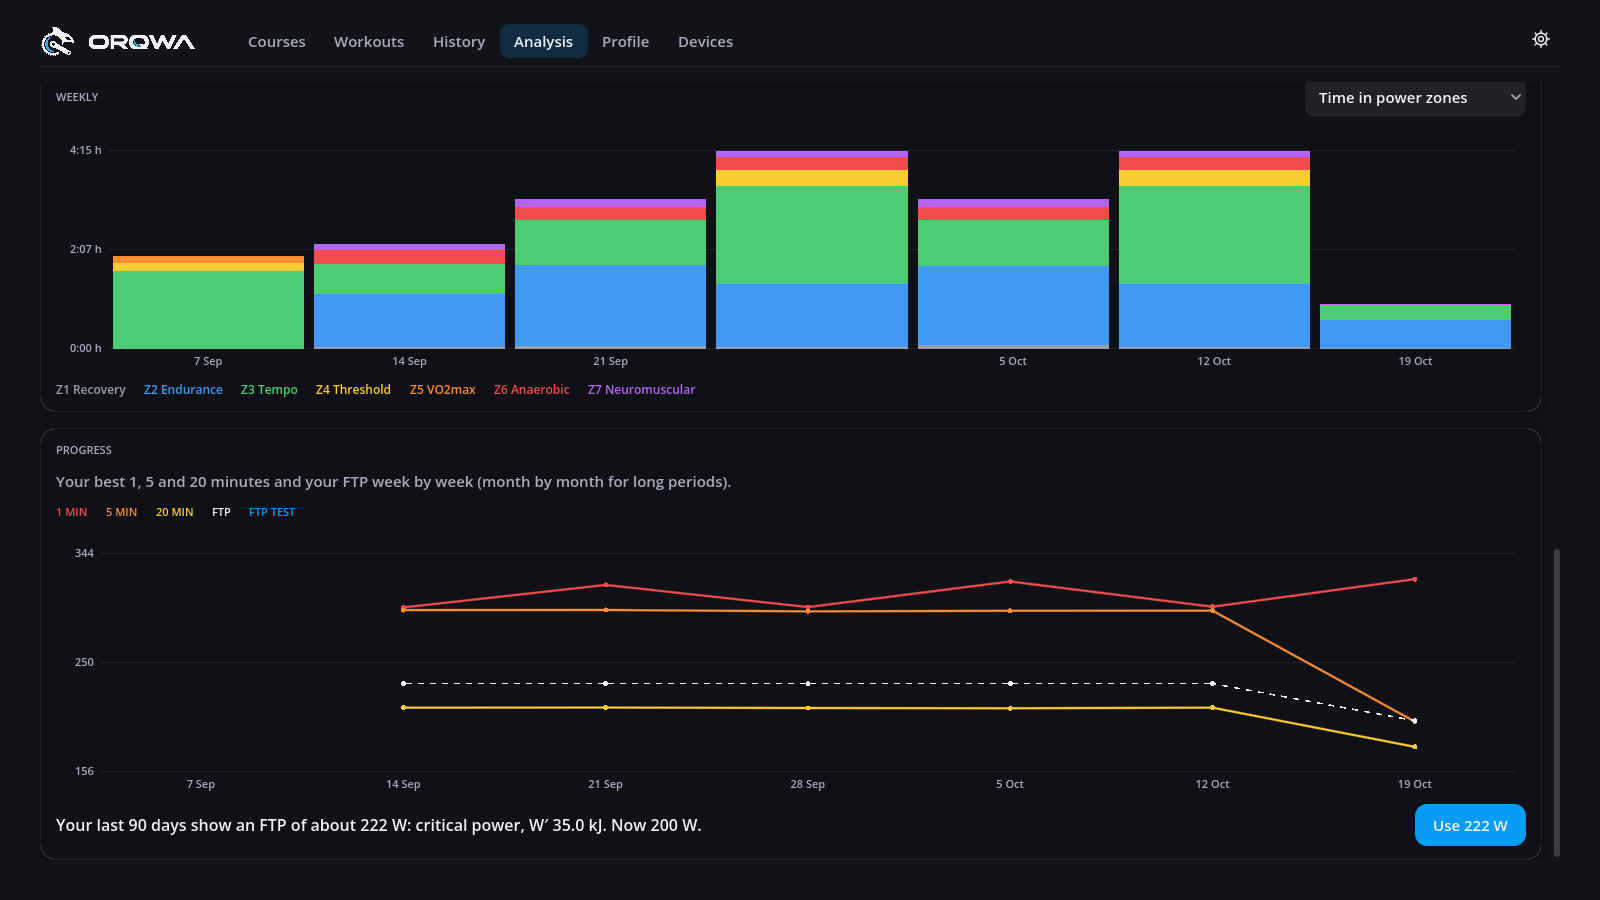
Below it, ORQWA estimates your FTP from your best efforts of the last 90 days (at least one ride of 20 minutes or more); Use … W takes it over. It never changes your FTP by itself. The estimate is only as good as your hardest recent efforts; an FTP test gives a firmer number.