Repository navigation
Public transport network in a time window
The container /Output/PT_NetworkExport (cfg/main/Output/PT_NetworkExport.dms, #57) selects every public transport trip that runs in a time window on a chosen day. It gives these trips as line layers with their attributes: in the GeoDMS GUI for thematic maps, and as GeoPackage, parquet or csv files for GIS. It deduplicates trips that overlap in three ways: per line and shape, per segment from stop to stop, and per stretch of the network. On a stretch, a train or bus that skips stops counts as well (#138). The attributes of the trips are aggregated.
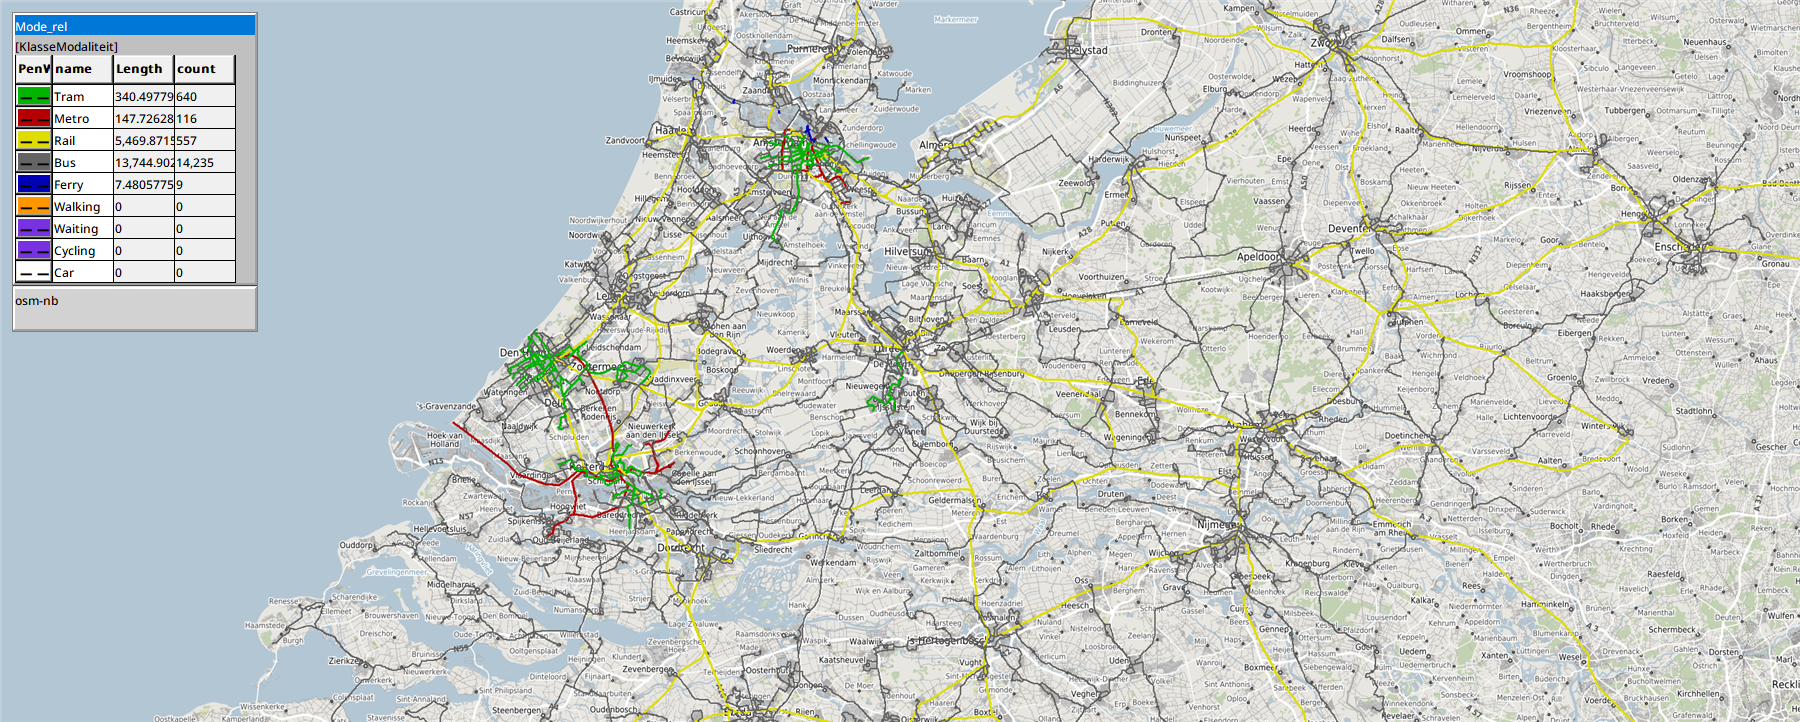
Tables/Segments/Mode_rel in a map view of the GeoDMS GUI: the segments of Tuesday 13 October 2026, 23:00 to 24:00, coloured by mode: tram green, metro red, rail yellow, bus grey, ferry blue. The legend of the layer gives the length in km and the number of segments per mode.
- Settings
- The day
- The layers
- Segment lines along the shape
- Lines that skip stops
- Viewing the layers in the GUI
- Export
- Example: 13 October 2026, 23:00 to 24:00
- Example: 14 October 2025, 07:00 to 09:00, the whole of the Netherlands
The settings are at the top of the container:
| parameter | default | meaning |
|---|---|---|
ExportDay |
ModelParameters/Impl/Analysis_date |
The day (yyyymmdd) whose trips are selected: any day that the loaded feed covers; see The day. |
WindowBegin, WindowEnd
|
'07:00', '09:00'
|
The window, as HH:MM on the time axis of ExportDay, up to 47:59: '25:00' is 01:00 the night after. A trip is selected when it runs at some moment in the window, not only when it departs in it. |
StopClusterDistance |
Advanced/DistanceStopClusters (100 m) |
Stops within this distance of each other form one node, also through other stops in between (single linkage): the platforms of a station, the stops on both sides of a street. At 0 m only stops at the same place merge. |
MaxDistanceStopShape |
100 m | A stop further than this from the shape of its trip is not projected on the shape; its segment becomes a straight line. |
SegmentsUndirected |
true |
true: both directions between two nodes form one segment, with nr_heen and nr_terug; false: one segment per direction. |
MaxSkippedStops |
50 | A segment that skips more stops is not laid over the stretches in between; see Lines that skip stops. |
ChainLengthTolerance, ChainLengthMargin
|
0.02, 50 m |
How much the length of a sequence of other segments may differ from that of a segment that skips their stops: 2% of the length of the segment plus 50 m. |
SkippedStopDistance |
30 m | How far a skipped stop may lie from the line of the segment. |
ExportFormat |
'gpkg' |
'gpkg', 'parquet' (zstd) or 'csv' (the geometry as WKT). |
The feed is that of the analysis moment of the model: ModelParameters/AnalysisMoment sets Impl/GTFS_file_date and the GTFS cache (see Create routable network from GTFS files). For another year, set AnalysisMoment; the container does not choose a cache of its own. The report names the first and last date of the feed.
The container selects the trips of ExportDay itself, so the selection does not depend on Analysis_date or on LoadFeeds/ServiceDays. It follows the same rules as the network (see Step 2 of the GTFS page):
-
Impl/Daysholds D−1, D and D+1 aroundExportDay. Their dates come fromTemplates/DayNr_TandTemplates/CivilDate_T. - A service runs on a date when the sum of
exception_typeincalendar_datesfor that date is 1, as inLoadFeeds/Services/Today_exc. - On the time axis of D: from D−1 the stop times of 24:00 and later, minus 24 hours; from D all stop times; from D+1 the stop times before 24:00, plus 24 hours. Of each day only the trips that overlap the window count. Each day uses
LoadFeeds/DayLinks_T, the same template the network uses. - All trips are included, also the flex options that the model thins out (
LoadFeeds/FlexOptions).in_ovnetis false for such a thinned flex option. As in the model, a flex trip competes only with the trips of its own day (Impl/PartOfDay_T/KeepFlexOption). It does not followAdvanced/IncludeFlex: withFALSEthe two fare groups of the model (Set_R,Set_L) leave out all flex trips, butin_ovnetstays true for them (#156).
Two checks stop the run with a failed integrity check, as in the network:
-
Impl/Check_DaysComplete: every day the window needs has at leastAdvanced/MinServiceDayTripShareof the trips of the busiest day with the same weekday. The window always needs D, D−1 when it starts beforeModelParameters/Impl/PrevServiceDayTailEnd(06:00), and D+1 when it ends after midnight. -
Impl/Check_NoDSTChange: D, and D+1 when needed, is not the last Sunday of March or October.
The five tables are in Tables: TripsInWindow, RouteVariants, StopNodes, Segments and Stretches. The headings below give the names of their layers in the export. The tables have no storage, so looking at them in the GUI writes nothing. Their relations refer to classifications in Classes with a colour and a line width (PenColor, PenWidth), so a map view colours them directly.
One row per trip instance (a trip on one day of Days) that overlaps the window. A trip with only one stop has no link and is left out.
- Relations:
Route_rel,Agency_rel,Mode_rel(Classes/ModeClasses),FlexClass_rel(Classes/FlexClasses),RouteVariant_rel. - Columns:
trip_id,dienstdag(D−1, D or D+1),Datum,vertrek,aankomst,duur_min,lijn,lijnnaam,aanbieder,modaliteit,is_flex,in_ovnet,heeft_shape,nr_haltes,eerste_halte,laatste_halte,headsign,richting,lengte_km,lijnvoering. - Geometry: the shape of the trip (
shapes.txt); a trip without a shape gets a line along its stops.
The trips deduplicated per line (route) and shape; a trip without a shape is grouped per line and stop pattern (first stop, last stop, number of stops). Each row has one operator, one mode and one flex value, those of its first trip.
- Columns:
lijnvoering,lijn,lijnnaam,aanbieder,modaliteit,is_flex,nr_ritten,ritten_per_uur,nr_in_ovnet,eerste_vertrek,laatste_vertrek,gem_duur_min,nr_haltes,eerste_halte,laatste_halte,bron_geometrie(shapeorhaltes),lengte_km. -
lijnvoeringis the row number of the line variant, counted from 0;lijnvoeringofRittenrefers to it.
The nodes cluster the stops within StopClusterDistance (join_near_values and connected_parts, as in PT_Hubs) over all stops of the feed, so that the clusters do not depend on the day or the window. The layer keeps the nodes with departures or arrivals in the window and numbers them within that selection (knoop, from 0). The number of a node can therefore differ between exports of another day or window, and so can van_knoop and naar_knoop of Segmenten and Verbindingen, which use the same numbers (#156). The busiest stop of a node in the window gives its name and point.
- Columns:
knoop,knoopnaam,nr_haltes,nr_vertrekken,vertrekken_per_uur,modaliteiten,nr_lijnen.
The stop-to-stop links in the window between two different nodes, deduplicated per pair of nodes and mode. With SegmentsUndirected both directions form one segment; nr_heen counts the passages from the node with the lowest number. Links within one node, between platforms of a station for example, form no segment. Neither do links between two nodes on a trip without a mode, whose GTFS route_type has no mode in Classifications/GTFS_Modes/Selection. The report counts both.
- Relations:
FromNode_rel,ToNode_rel,Mode_rel,Agency_rel(the operator with the most passages),FlexClass_rel(fixed, partly flex, flex). - Columns:
van_knoop,naar_knoop,van_naam,naar_naam,modaliteit,nr_passages,per_uur,nr_heen,nr_terug,nr_lijnen,lijnen,aanbieders,aanbieder,nr_flex,aandeel_flex,flexklasse,nr_in_ovnet,min_reistijd_min,gem_reistijd_min,eerste_vertrek,laatste_vertrek,lengte_km,bron_geometrie(shapeorrecht).
The stretches of the network: the segments that skip no stops. Each stretch carries every line and passage that runs over it, also those of the trains and buses that skip its nodes (see Lines that skip stops). A map of the number of lines per stretch therefore shows the total, and a fast service does not lie on top of the stretches of a slow one. The line, the length and the nodes are those of the segment.
- Relations:
FromNode_rel,ToNode_rel,Mode_rel,Agency_rel(the operator with the most passages),FlexClass_rel, the last two over all passages. - Columns:
van_knoop,naar_knoop,van_naam,naar_naam,modaliteit,nr_lijnen,nr_lijnen_stoppend,nr_lijnen_doorrijdend,lijnen,nr_passages,per_uur,nr_passages_stoppend,nr_passages_doorrijdend,aanbieders,aanbieder,nr_flex,aandeel_flex,flexklasse,nr_in_ovnet,lengte_km,bron_geometrie. -
nr_lijnenisnr_lijnen_stoppend, the lines that stop at both nodes at least once (thenr_lijnenof the segment), plusnr_lijnen_doorrijdend, the lines that only run over the stretch without stopping at one of its nodes. The passages are split in the same way.
The line of a segment follows the shape of a representative link: the first link in the window whose trip has a shape. Its stops A and B are projected onto that shape with connect_info_eq: the projection of connect, restricted to the shape of the trip itself. For each stop it gives the segment of the shape (SegmID) and the projected point (CutPoint). The line runs:
- from A to its projection;
- along the vertices of the shape from
SegmIDof A + 1 up toSegmIDof B; - from the projection of B to B.
The first and last pieces are the connection lines from stop to shape that connect adds as well. The vertices come from sequence2points on the shapes in use. The points of all segments are laid out one after the other with classify on cumulative offsets (Impl/SegGeom). connect_info_eq takes the maximum distance squared, so Impl/SegGeom/MaxDistance2 passes the square of MaxDistanceStopShape.
A segment becomes the straight line from A to B when:
- no link of the segment has a shape;
- a stop is further than
MaxDistanceStopShapefrom the shape; - B does not come after A on the shape, which happens on a loop where the last stop coincides with the first.
A stop with a latitude or a longitude of 0 in the feed gets the point of its parent_station, in LoadFeeds/RawStops for the whole model (see Step 3 of the GTFS page); the report counts these stops.
An Intercity from Utrecht Centraal to Amsterdam Amstel gives one segment, the Sprinter between the same stations eight. In Segmenten the Intercity segment lies on top of the eight Sprinter segments, and its trains do not count on them. Impl/SkippedStops lays a segment that skips stops over the stretches that it runs over, in four steps.
The links of the segments of each trip instance are put in the order of the trip, by the position of their stop time (Links/Ordinal). Every run of 2 up to MaxSkippedStops + 1 consecutive links of a trip is a sequence of links (Impl/SkippedStops/Chains). Its two ends and the mode of the trip give the segment between them, if there is one. A Sprinter that stops at every station between Utrecht Centraal and Amsterdam Amstel gives, among others, the sequence of its eight links between those two stations. That sequence has the same pair of nodes as the Intercity segment.
A sequence of links fits a segment when:
- its length differs from that of the segment by at most
ChainLengthTolerancetimes the length of the segment plusChainLengthMargin, 2% plus 50 m, both lengths measured along the shapes, without the pieces from the stops to the shape; - each stop of the sequence in between lies within
SkippedStopDistance, 30 m, of the line of the segment.
The condition on the length keeps out loops and detours of a line that pass the same stops. The condition on the distance keeps out a line over a parallel road of about the same length, and a pair of one-way streets that a line takes in either direction. A stop on the same road lies a few metres from the line, a stop on a parallel street farther away. Of the sequences that fit, the one with the most links counts, because it follows the stops most closely. A sequence with a segment that is not shorter than the segment itself does not count; that also prevents two segments from each running over the other.
Each passage of a segment that skips stops is replaced by the same passage on each segment of its sequence. A segment of that sequence can skip stops itself: an ICE from Utrecht Centraal to Amsterdam Centraal runs over Utrecht Centraal to Amsterdam Amstel, an Intercity segment. The next round replaces such a passage again. There are three rounds; the third check of the report tells whether they were enough.
The segments that skip no stops are the stretches (Tables/Stretches, layer Verbindingen). Each keeps the passages and lines of its own segment as stopping ones and gets the replaced passages as passing ones (nr_passages_doorrijdend). A segment that skips stops but has no sequence that fits stays a stretch of its own, on top of the stretches it passes. This happens, for example, when no train in the window stops in between, or for a straight segment without a usable shape, whose length can fall short of that of a sequence along the road.
With the feed of 30 September 2025, the window 07:00 to 09:00 on Tuesday 14 October 2025 has 31,101 segments. 455 of them skip stops and run over a sequence of others; the other 30,646 are the stretches. The checks of the report pass. The table gives the modes in which segments skip stops, as the report does; the other 144 segments, of other modes such as metro and ferry, skip none.
| mode | segments | that skip stops | stretches with lines that run over them without stopping |
|---|---|---|---|
| rail | 660 | 89 | 233 |
| bus | 29,585 | 365 | 657 |
| tram | 712 | 1 | 2 |

The layer Verbindingen in and around Friesland, coloured by per_uur: the passages per hour over the stretch, stopping and passing, in both directions together. The grey rectangle is the frame of the map; the legend gives the length in km and the number of stretches per class.
On the stretch from Breukelen to Abcoude, 2 Sprinter series stop, with 16 passages. Over the same stretch, 9 lines run without stopping, with 54 passages: the Intercity trains from Utrecht Centraal to Amsterdam Amstel (4 lines, 26 passages) and to Amsterdam Bijlmer ArenA (3 lines, 26 passages), and 2 ICE International trains from Utrecht Centraal to Amsterdam Centraal. A Nightjet from Rotterdam Centraal to Eindhoven and a Eurostar from Rotterdam Centraal to Brussel-Zuid stay stretches of their own: their lengths differ 3.4% and 3.3% from those of the sequences of links of an Intercity via Breda and Tilburg and of a Eurocity Direct via Antwerpen.
Open cfg/main.dms in the GeoDMS GUI and set ExportDay, WindowBegin and WindowEnd at the top of Output/PT_NetworkExport. Then:
- Select
/Output/PT_NetworkExport/Tables/Segments/Mode_relin the tree, or type that path in the address bar. - Open a map view (View > Map View, Ctrl+M). The segments are drawn on the background map, coloured and sized per mode with the legend of the layer.
- Any other attribute of the same table can be shown the same way:
FlexClass_relfor fixed and flex services,per_uurornr_lijnenfor a classification of the numbers.Tables/StopNodesshows the nodes as points, andTables/Stretches/nr_lijnenthe number of lines per stretch, with the lines that run over it without stopping.
The first map view computes the selection. The view starts zoomed out to all trips, including the international trains into Germany and Belgium.
/Output/PT_NetworkExport/Generate writes the five layers and the report in one request. From a command line:
GeoDmsRun.exe /L<log file> cfg\main.dms /Output/PT_NetworkExport/Generate
The files are %LocalDataProjDir%/Output/ptwindow_<feed>_<day>_<window>_<layer>.<format>, for example ptwindow_20260925_20261013_23h00m-24h00m_segmenten.gpkg, with _report.txt next to them. The export writes the relations as text (aanbieder, modaliteit, flexklasse) and the numbers as numbers. GDAL_LayerCreationOptions is GEOMETRY=AS_WKT for csv and COMPRESSION=ZSTD for parquet.
The report lists the days and their checks, the number of rows per layer, the trips without a shape, the segments along the shape and straight, the segments that skip stops per mode, and the links within a node and without a mode. It ends with three checks: the trips are the sum of nr_ritten of the line variants; the links in the window are the sum of nr_passages of the segments plus the links within a node and the links without a mode; and every passage of a segment that skips stops lies on stretches, while each stretch keeps the passages and lines of its own segment.
With the feed of 25 September 2026 the window 23:00 to 24:00 on Tuesday 13 October 2026 gives:
| layer | rows | notes |
|---|---|---|
| Ritten | 4,997 | 66 without a shape; 929 flex, of which 156 thinned flex options outside the model network |
| Lijnvoeringen | 2,073 | 2,022 per shape, 51 per stop pattern |
| Knopen | 13,244 | |
| Segmenten | 15,557 | 14,841 along the shape, 147 straight with a shape, 569 straight without a shape |
| Verbindingen | 15,369 | 376 with lines that run over them without stopping; 188 segments skip stops (rail 62, bus 126) |
There are 62,015 links in the window, 339 of them within a node and none without a mode, and the three checks pass. Per mode:
| mode | segments | length (km) | passages |
|---|---|---|---|
| tram | 640 | 340 | 6,333 |
| metro | 116 | 148 | 1,464 |
| rail | 557 | 5,470 | 2,143 |
| bus | 14,235 | 13,745 | 51,670 |
| ferry | 9 | 7.5 | 66 |
The rail length includes the international trains in Germany and Belgium; the longest segment is Würzburg to Kassel of the Nightjet (204 km). Of the 929 flex trips, 756 are U-OV Flex in Utrecht, whose main patterns the feed schedules as a trip every minute; 155 of these 756 trips are thinned flex options. Most straight segments are buses of De Lijn in Flanders, which have no shapes in the feed.
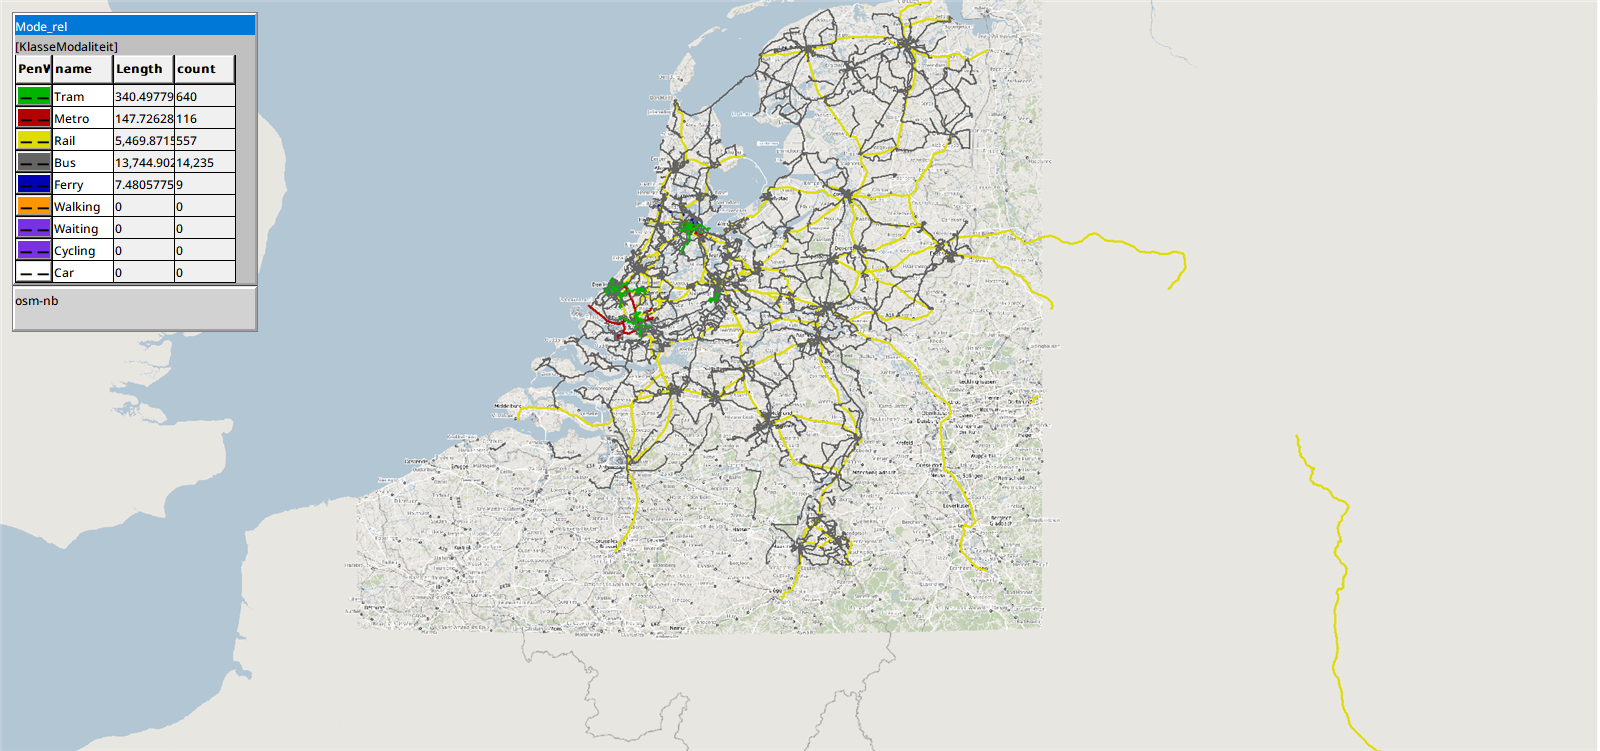
The same layer zoomed out: the network between 23:00 and 24:00, with the international trains to Germany and the bus network of De Lijn in Flanders.
The two maps below show the export of the window 07:00 to 09:00 on Tuesday 14 October 2025, with the feed of 30 September 2025. They are drawn from the gpkg files of the export in a map view of the GeoDMS GUI, with classes of their own. Only the parts of the lines in the Netherlands are drawn: within 1 km of its land, and for a ferry within 15 km, so that the crossings of the Wadden Sea and the Westerschelde stay whole. Nothing in Belgium is drawn. Of the 4,660 line variants, 4,400 run at least partly in the Netherlands, and so do 27,550 of the 30,646 stretches.

The layer Lijnvoeringen by mode: bus grey, tram green, metro red, ferry blue, rail yellow, and the flex lines (is_flex) purple, drawn on top. Of the 522 flex line variants, 424 are the Opstapper in Friesland and 55 are U-flex in the province of Utrecht. The legend gives the length in km and the number of drawn lines per class.

The layer Verbindingen by nr_passages: the trips over the stretch between 07:00 and 09:00, in both directions together, stopping and passing. The class 32+ has 16 trips an hour or more. The legend gives the length in km and the number of drawn stretches per class.