This project is an application that reads natality data from a CSV file and displays it using two different types of graphs (pie chart and column chart). The purpose of this project is to visualize natality data and perform various calculations for better understanding and analysis.
Reads natality data from a CSV file and display it, along with different calculations, using two different types of graphs.
- Java Development Kit (JDK) version 8 or later
- Clone "NatalityMini.csv"
- Locate the CSV file inside the Java files package
Main- Main function definition. Creates the frame and its defaults (using Java swing).Chart- An abstract class to define a chart instance variables and functions.Column- Extends the abstract chart class. Implementation of a column graph type including drawing.Pie- Extends the abstract chart class. Implementation of a pie graph type including drawing.NatalityPanel- Extends JPanel and implements MouseListener. Reads the details from the CSV file and gets input from the user. Displays the graphs accordingly.
The program reads data from a CSV file using Java's File and BufferedReader. The program then proceeds to process the data and make different calculations.
Finally, creates a dynamic JPanel and two different types of graphs and displays one of them, according to the user's input.
The algorithm supports and displays extra data that the user can add by using the JButtons.
To compile and run the project, follow these steps:
- Clone the repository or download the source code.
- Import the project into your favorite Java IDE (e.g., Eclipse, IntelliJ IDEA).
- Ensure the required libraries and dependencies are properly set up.
- Compile and run the project from your IDE.
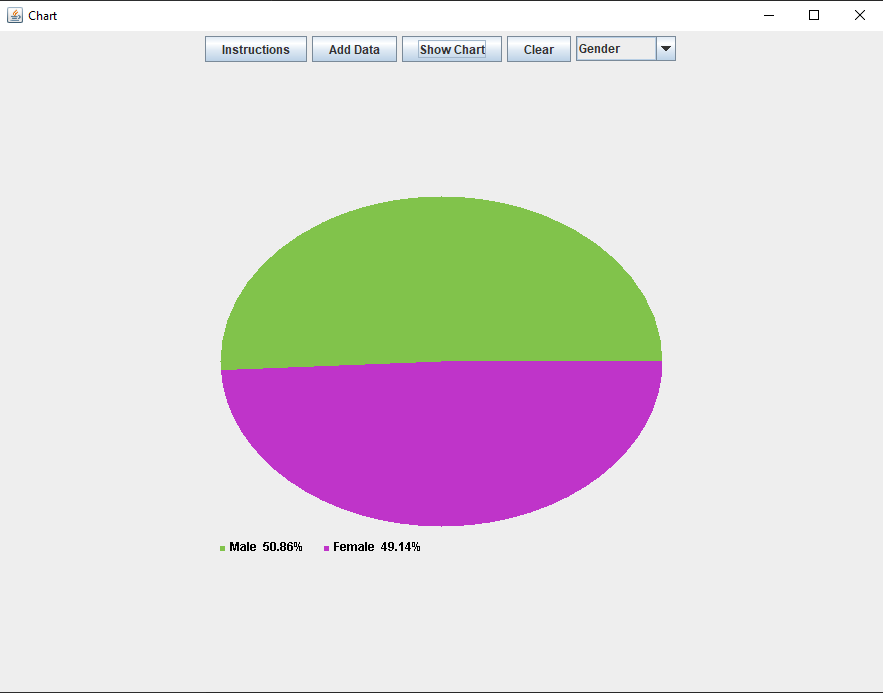
- Pie chart:
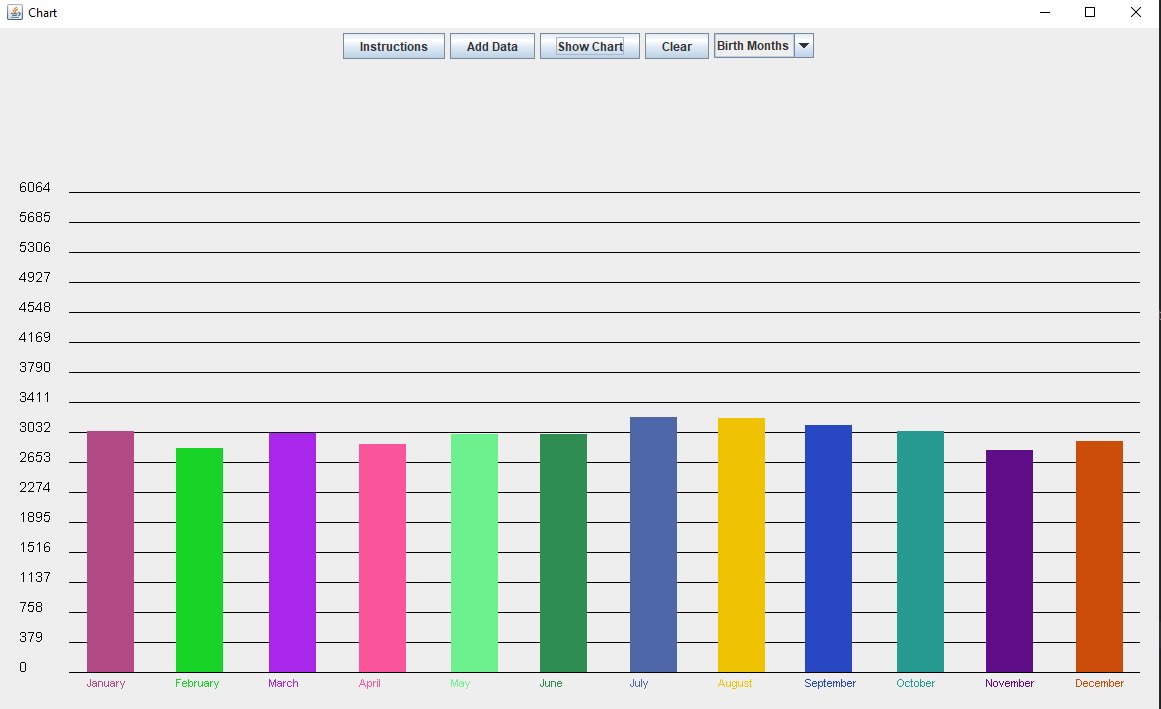
- Column chart: