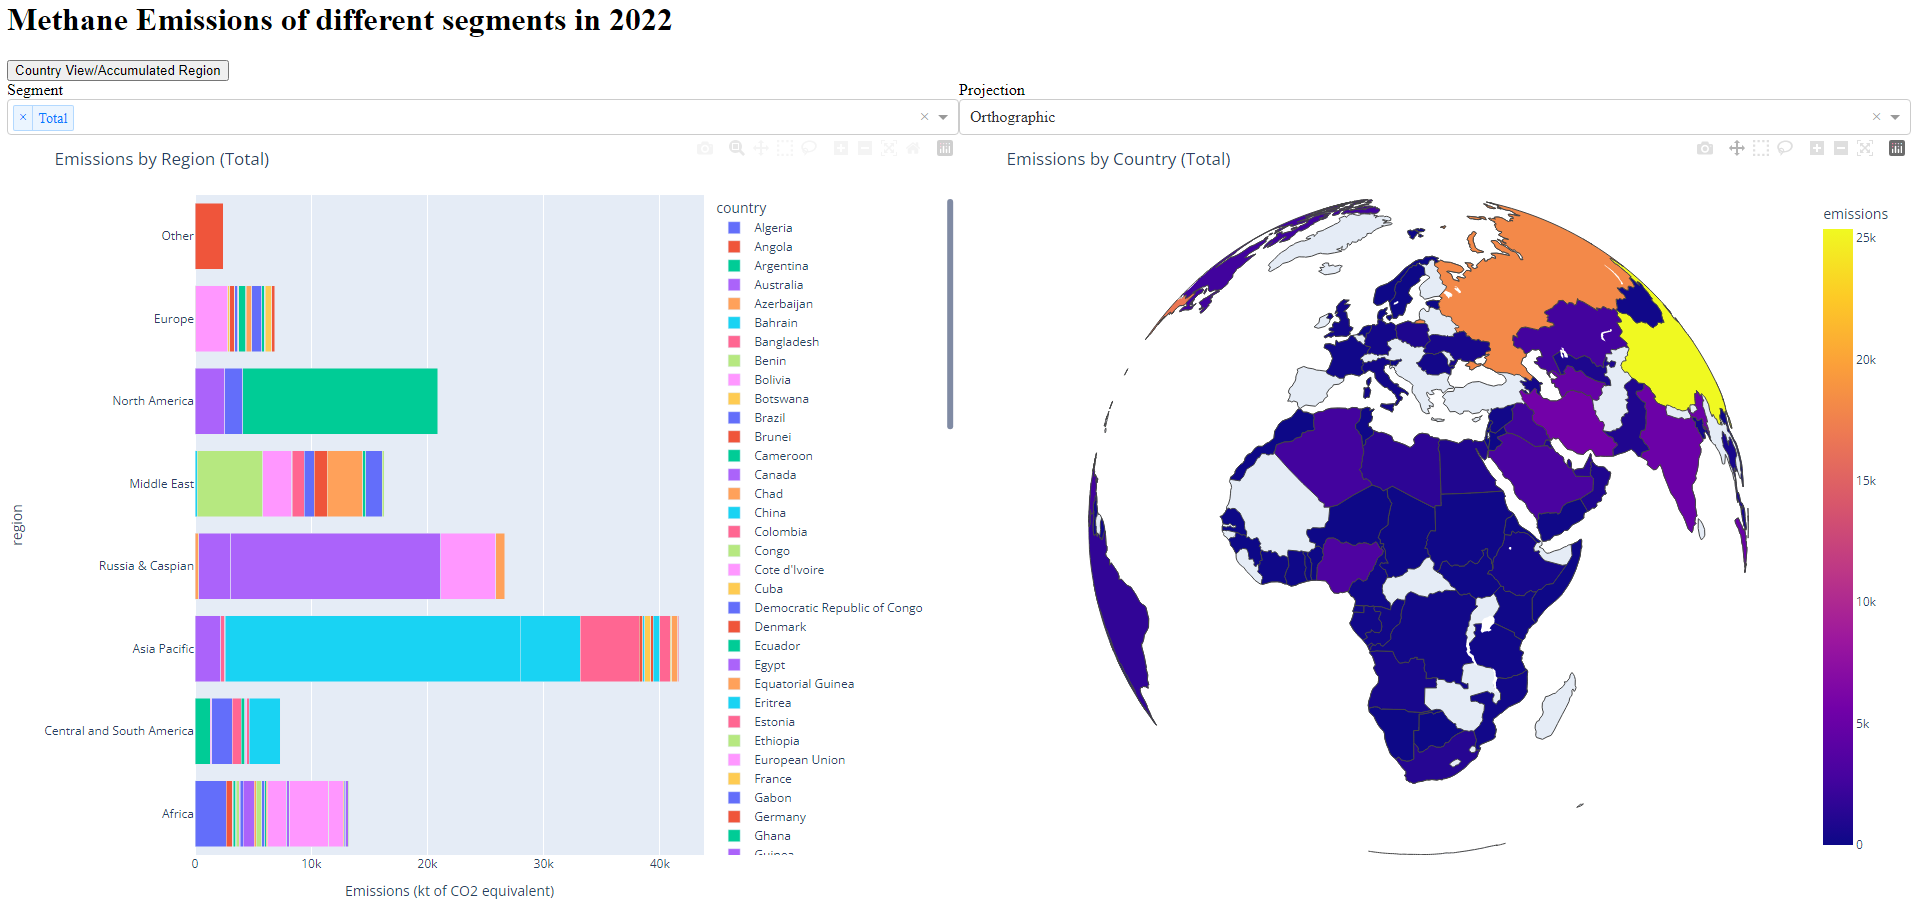
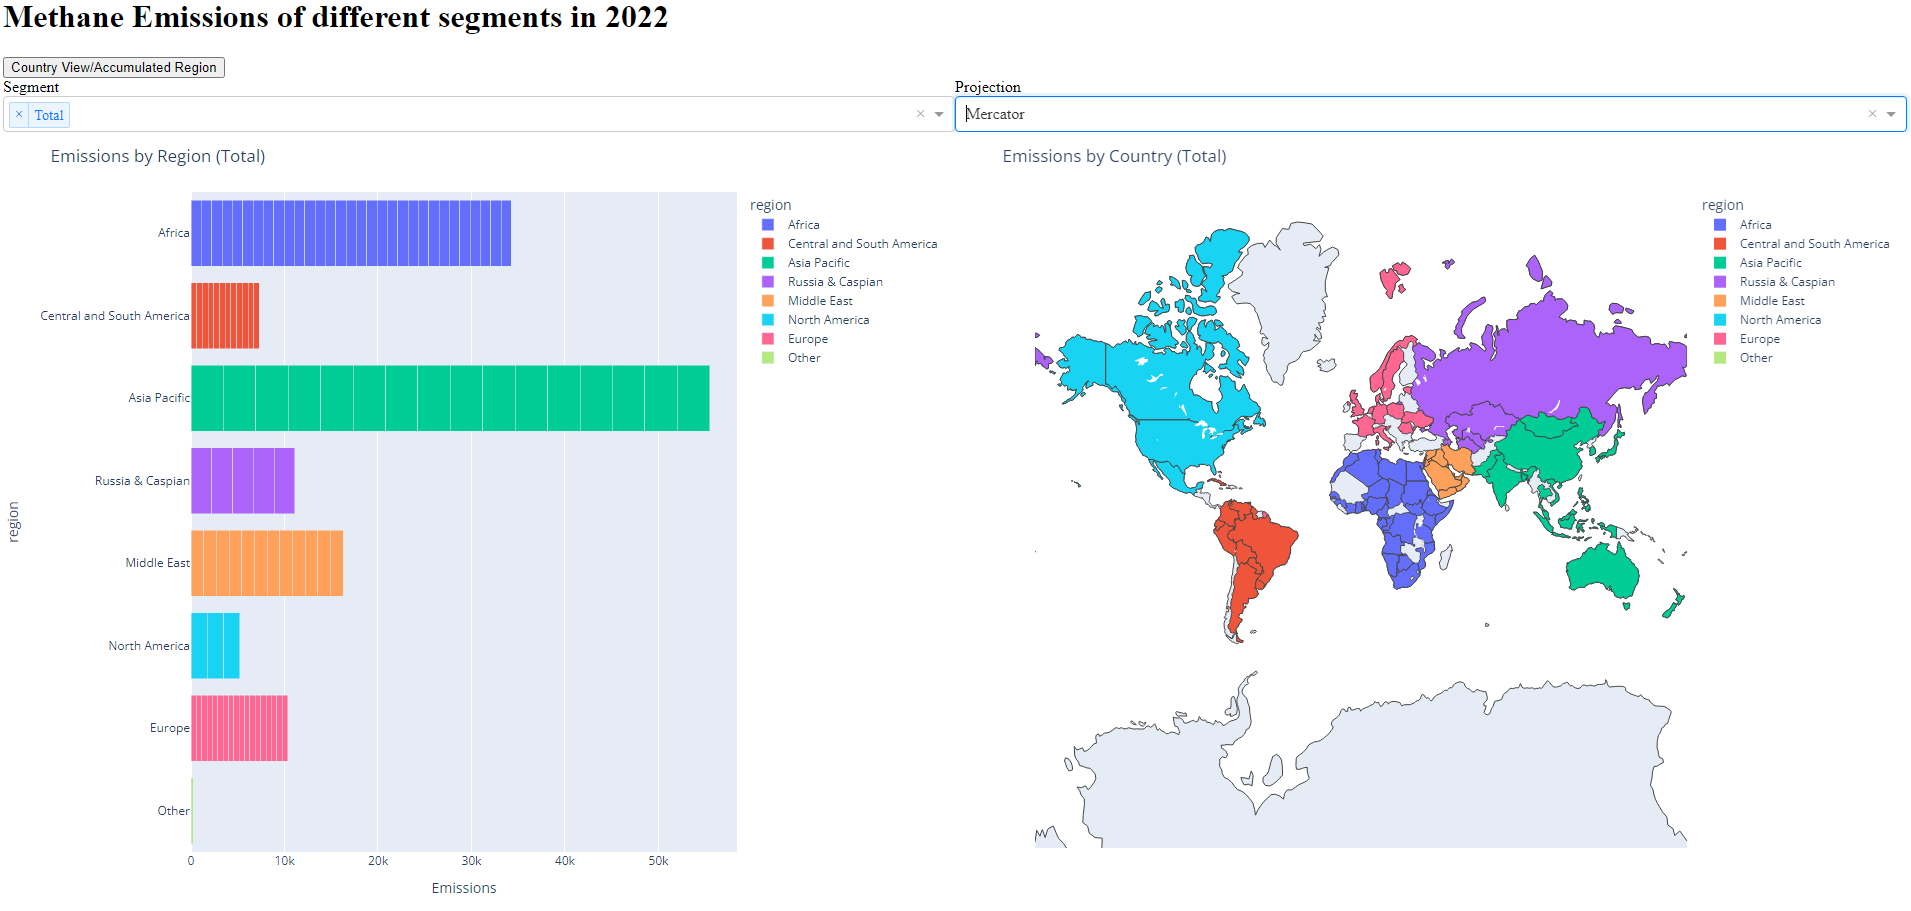
Methane Emissions Dashboard This dashboard presents methane emissions data for various regions, countries, and segments in 2022, based on the data in the Methane_final.csv file. The dashboard provides a stacked bar chart and a choropleth map for visualizing the data, and it allows users to filter the data by segment and projection.
Getting Started Before running the application, make sure that you have the necessary libraries installed. You can install the required libraries using the following command: pip install pandas plotly dash
To run the application, execute the following command:
Data Processing The Methane_final.csv file contains methane emissions data for different regions, countries, and segments. The data is processed using pandas and plotted using plotly and dash libraries.
The following steps are performed in the data processing:
Load the data from the CSV file and filter it for the year 2022 and exclude the 'World' region. Group the data by country and segment, aggregate emissions, and keep the first values of baseYear and region columns. Group the data by country and segment, sum the emissions, and reset the index. Group the data by region and segment, sum the emissions, and reset the index. Count the number of unique countries in each region and calculate the emissions per country. Merge the grouped data with the emissions per country data and keep only the necessary columns. Usage The dashboard allows users to filter the data by segment and projection. Users can select one or more segments from the dropdown filter to display data for specific segments. Users can also select different projections from the dropdown filter to view the choropleth map in different projections.
The dashboard includes a button that allows users to switch between country view and accumulated region view in the choropleth map. The button toggles between displaying the data for each country and displaying the data for each region.
Dashboard Components The dashboard includes the following components:
A stacked bar chart for visualizing the emissions data by region, country, and segment. A choropleth map for visualizing the emissions data by country and region. Dropdown filters for segment and projection selection. A button for switching between country view and accumulated region view in the choropleth map. Acknowledgements This dashboard was created by Mathias Profft. The data used in this dashboard was sourced from https://www.kaggle.com/datasets/ashishraut64/global-methane-emissions.