Unable to render charts in local research environment #7094
Description
Expected Behavior
Hello. I am trying to run a local research environment and am having trouble when running the example code at https://www.quantconnect.com/docs/v2/cloud-platform/research/getting-started.
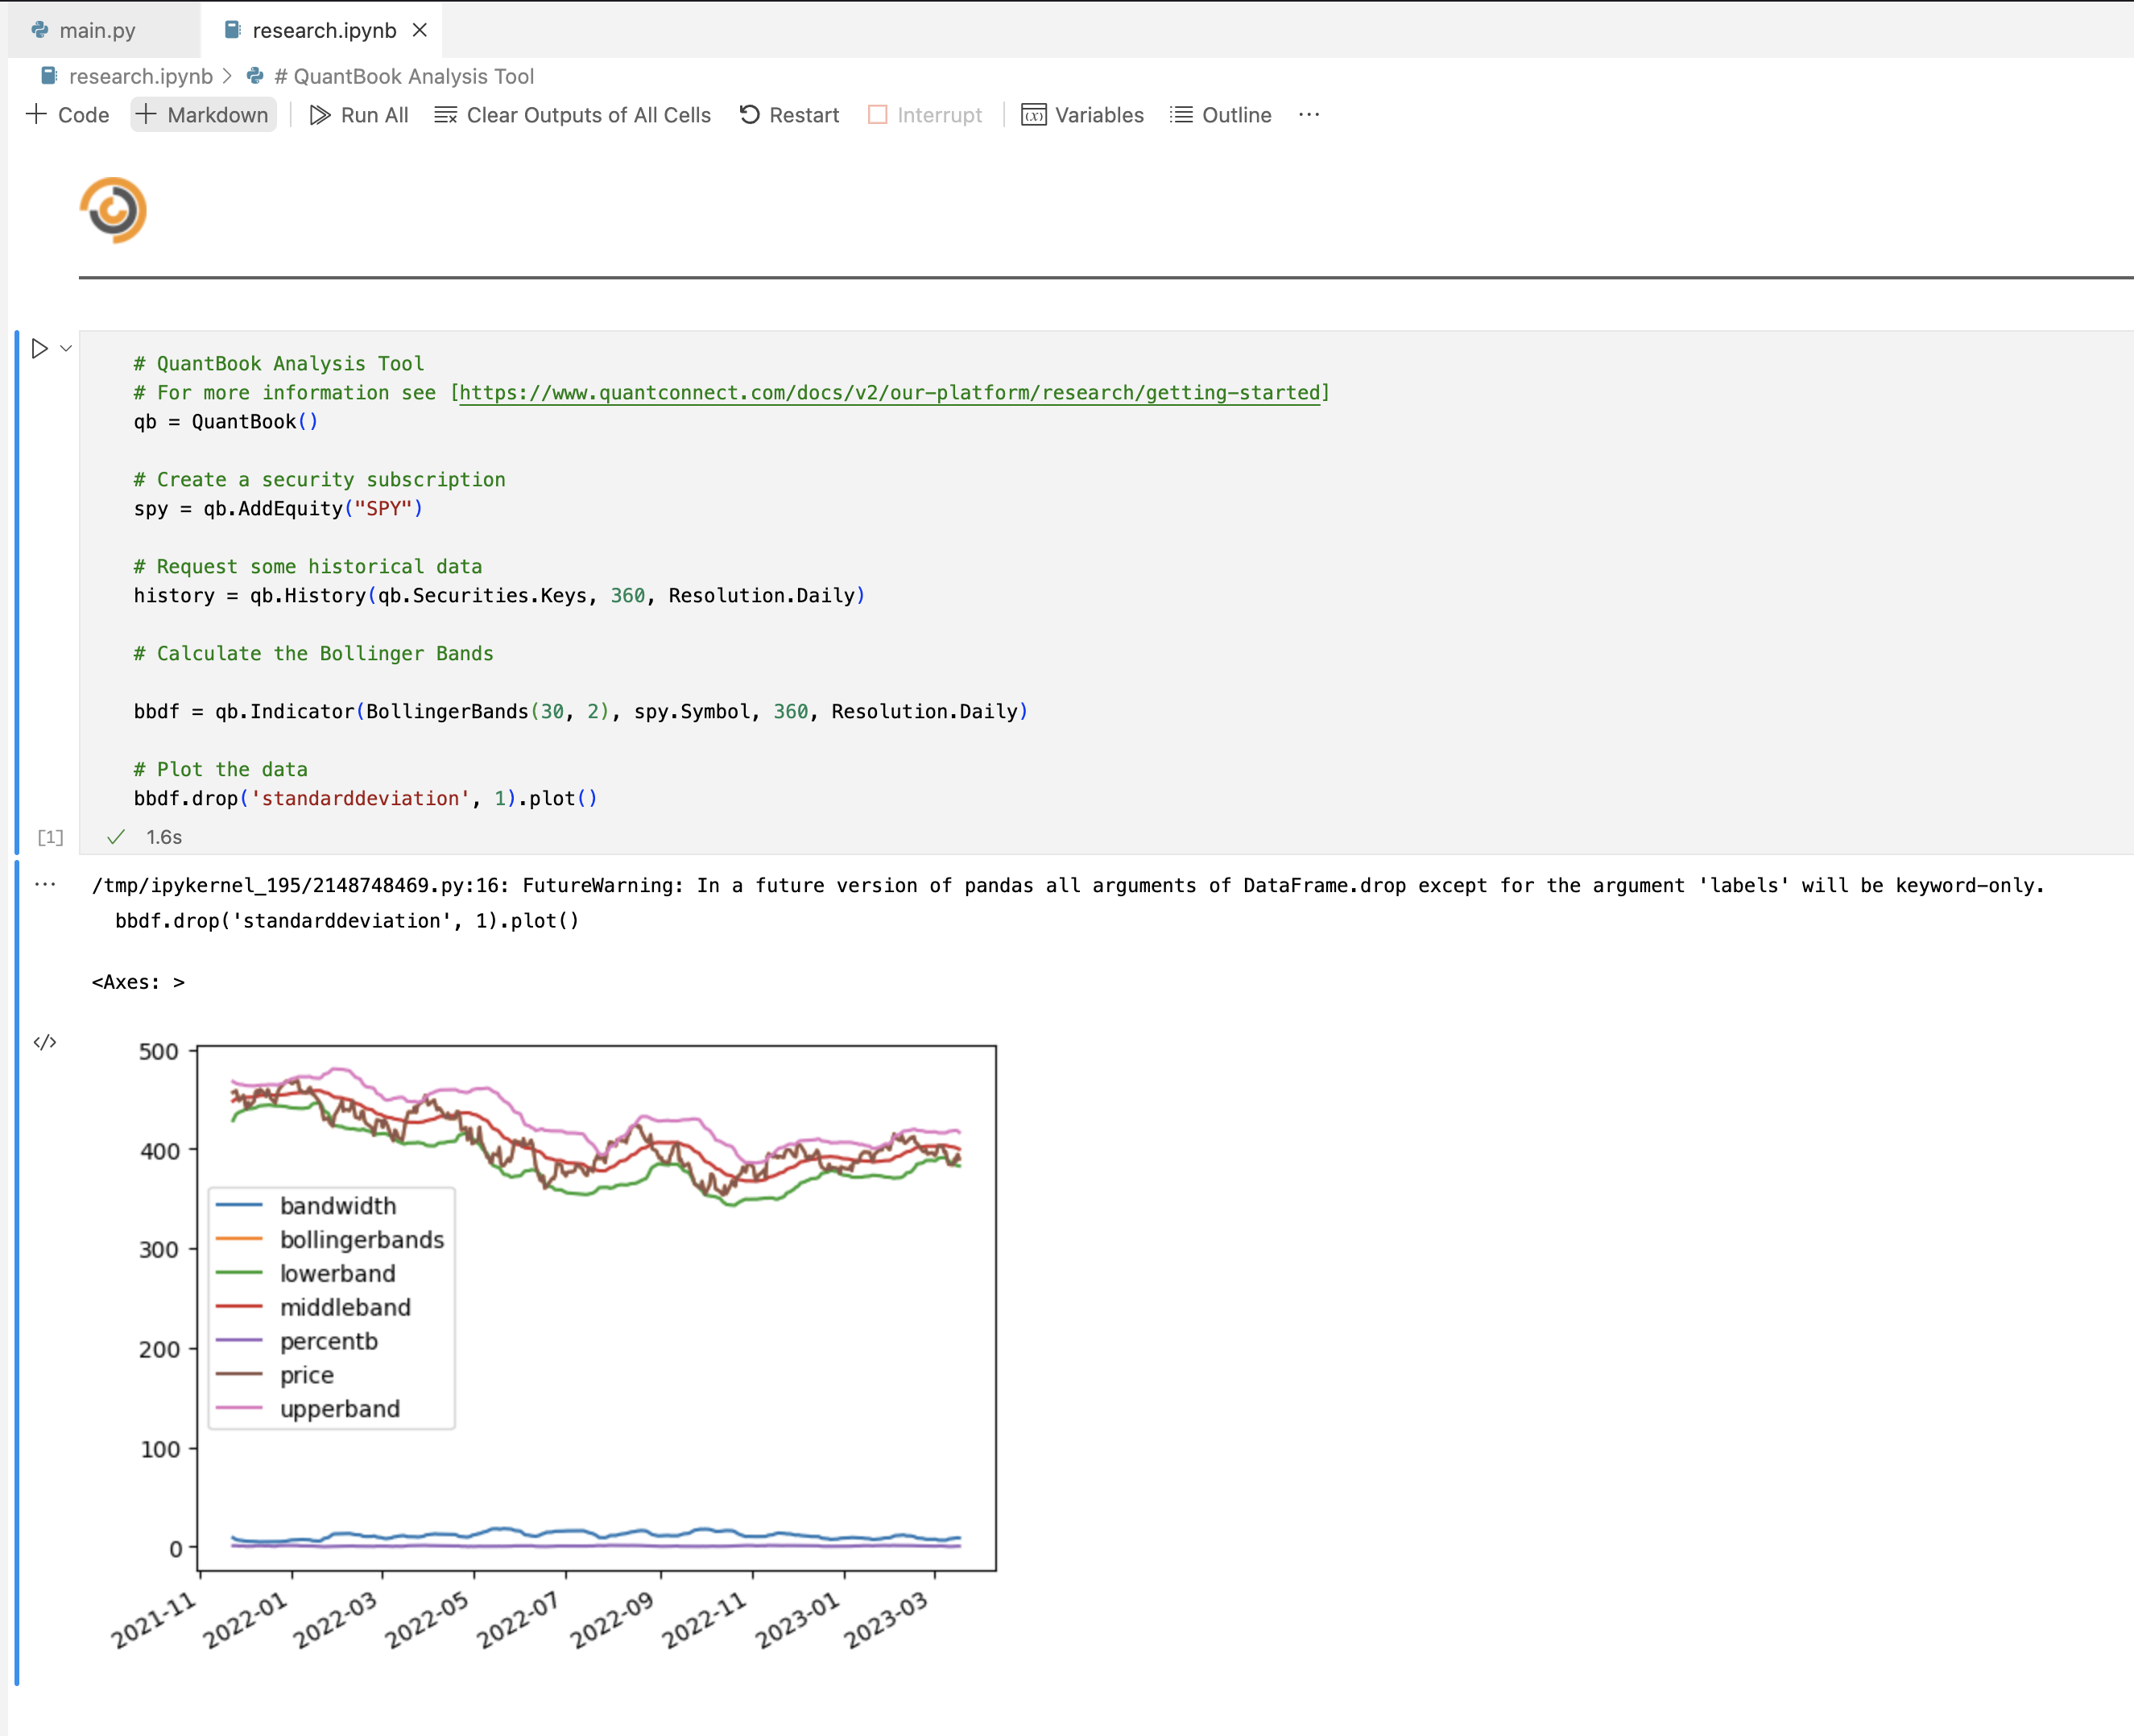
This works fine when I run it on the quantconnect website:
Actual Behavior
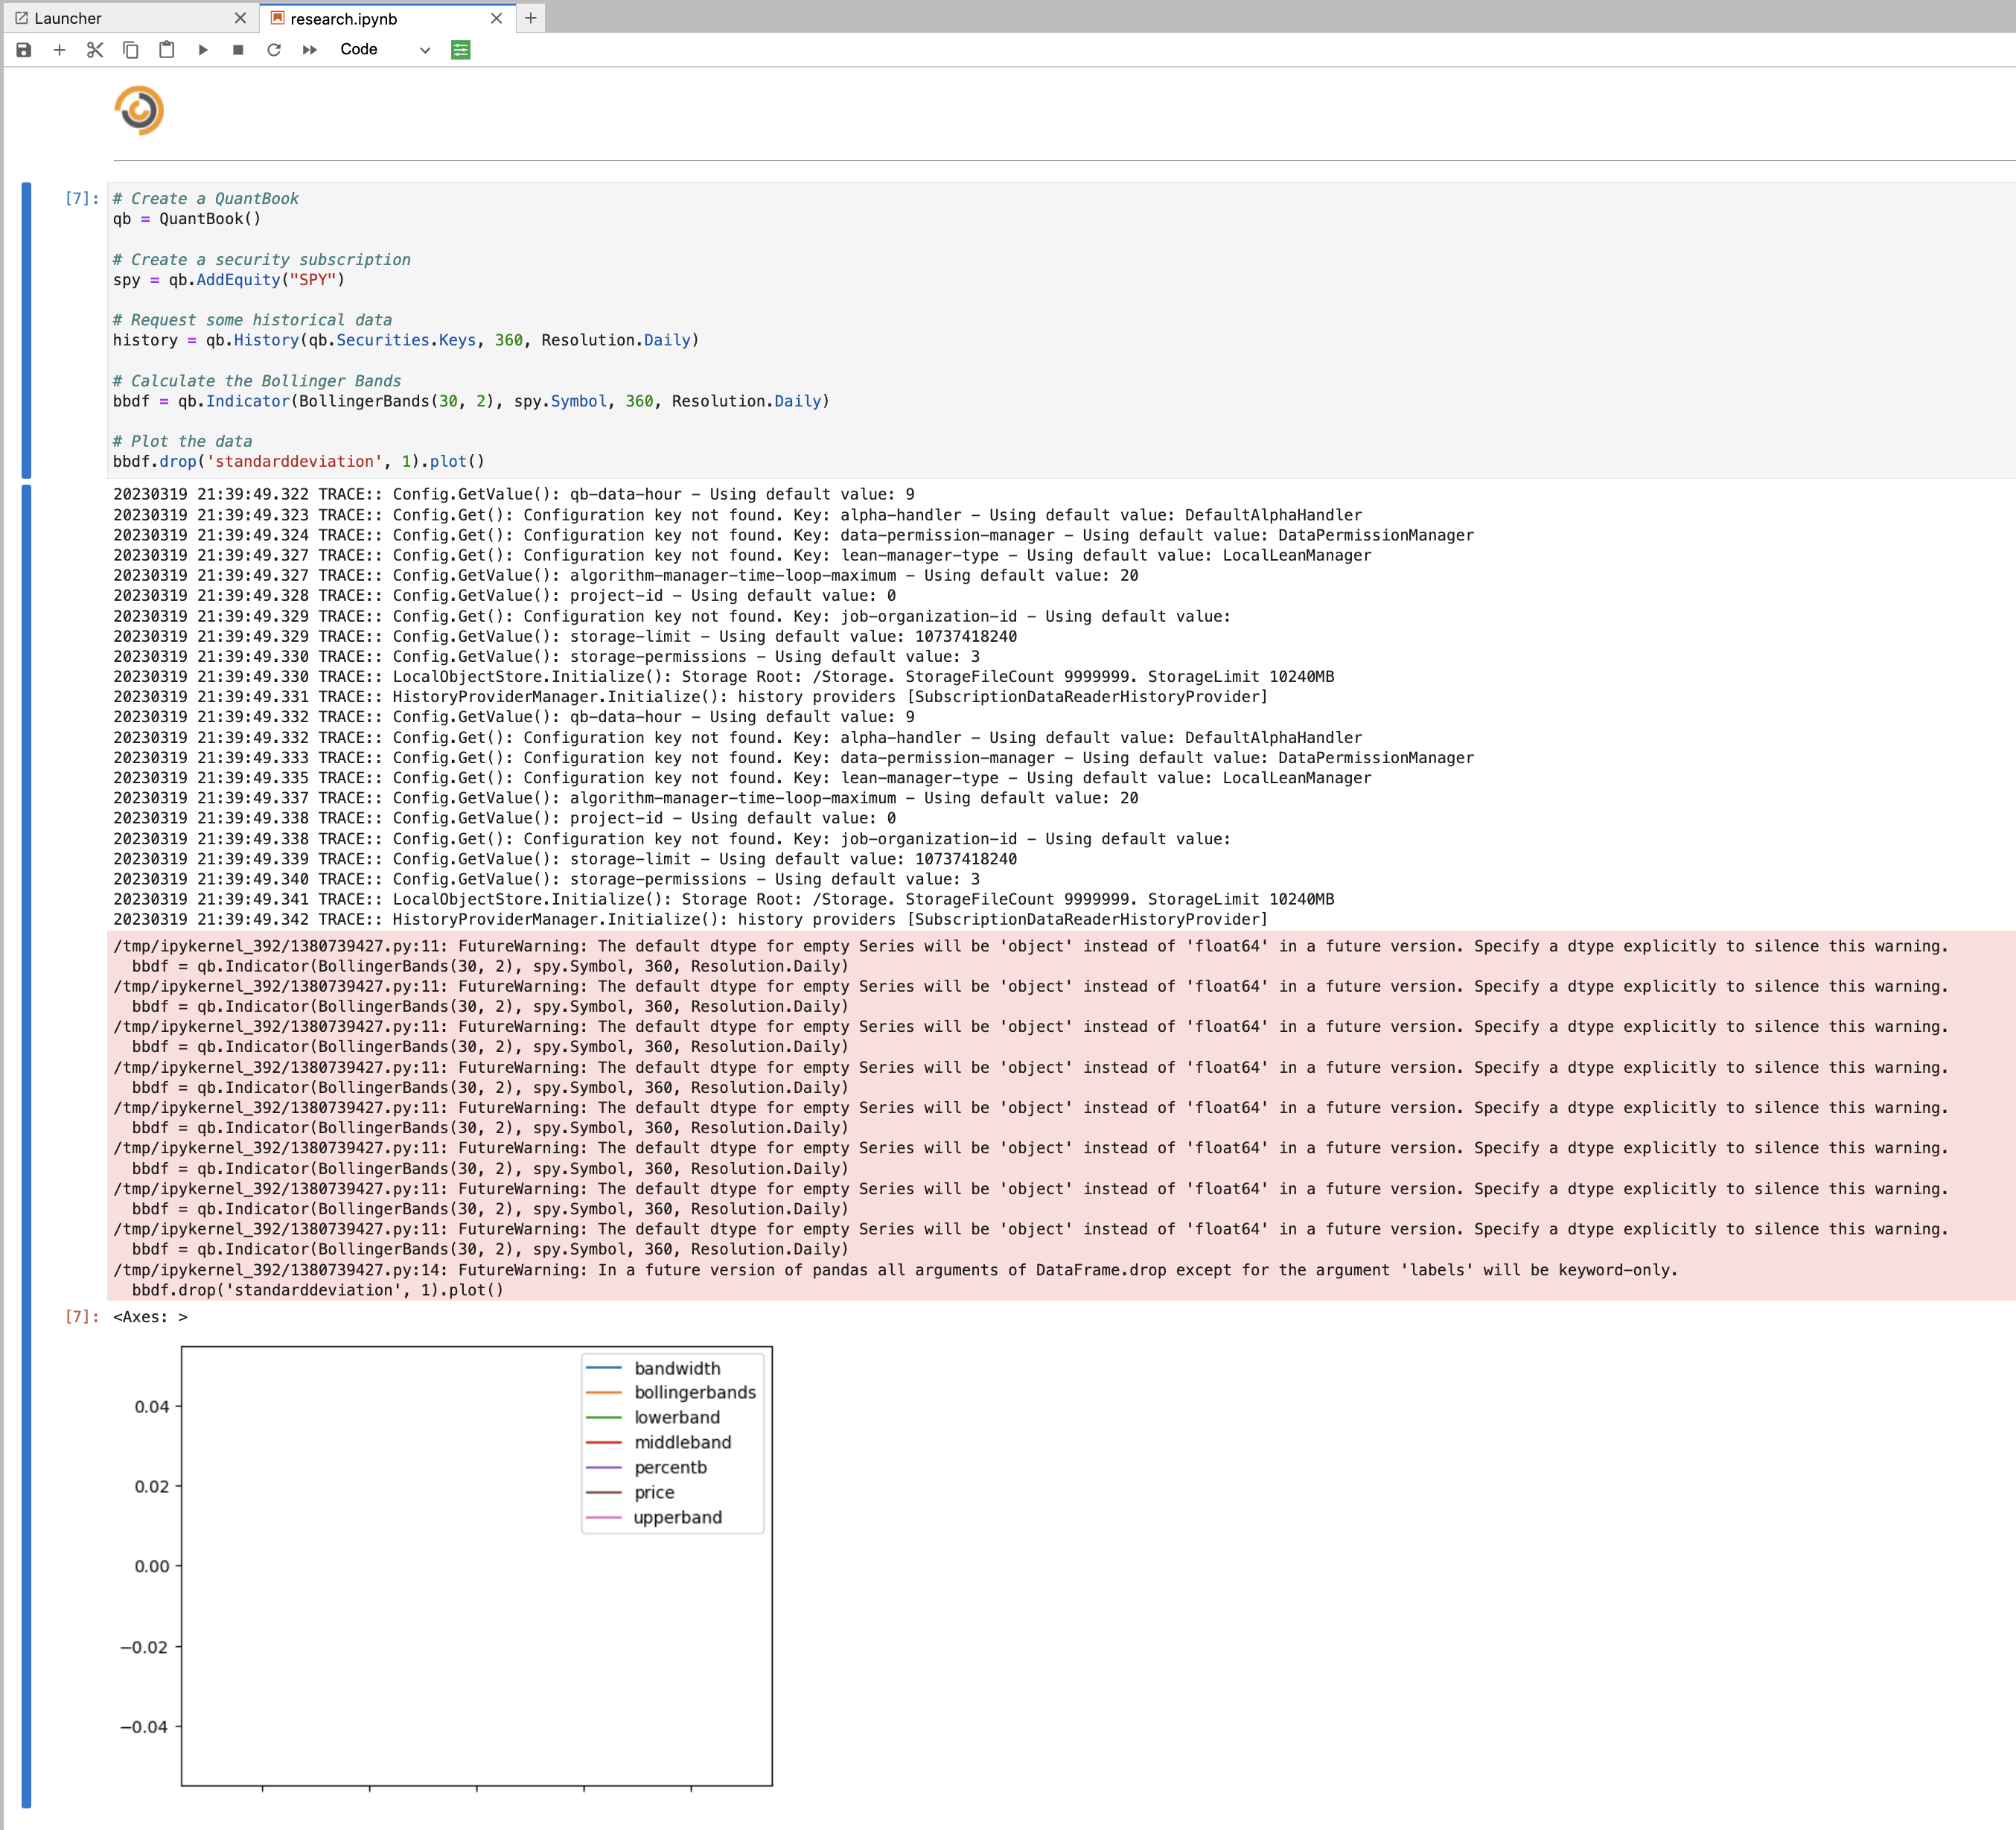
When I run it on my system, I get a series of warnings and a blank chart:
Reproducing the Problem
I ran the following commands to start lean:
$ pip install lean
$ lean init
$ lean create-project "My Project"
$ lean research "My Project"
I then went into research.ipynb and pasted in:
# Create a QuantBook
qb = QuantBook()

# Create a security subscription
spy = qb.AddEquity("SPY")

# Request some historical data
history = qb.History(qb.Securities.Keys, 360, Resolution.Daily)

# Calculate the Bollinger Bands
bbdf = qb.Indicator(BollingerBands(30, 2), spy.Symbol, 360, Resolution.Daily)

# Plot the data
bbdf.drop('standarddeviation', 1).plot()
... and then tried running it.
System Information
- macOS 13.2.1
- Docker Desktop
Checklist
- I have completely filled out this template
-
I have confirmed that this issue exists on the currentI am usingmasterbranchleanw/ thequantconnect/research:latestimage. - I have confirmed that this is not a duplicate issue by searching issues
- I have provided detailed steps to reproduce the issue