This Repository contains the multiple visualization Dashboards/projects. All the dataset , files and links used are provided in the Repository. It also includes visualizations from events like "Make Over Monday" that happens on weekly basis.


- DeeNaido - thank you for one of the best tableau project analysis teacher online.
- Nedko - Thank you for teaching tabeau basics.
- Andy Kriebel Thank you so much for organising such events
- My Self for working hard.
| Project No. | Viz Name | Dataset | Logo Used | Link |
|---|---|---|---|---|
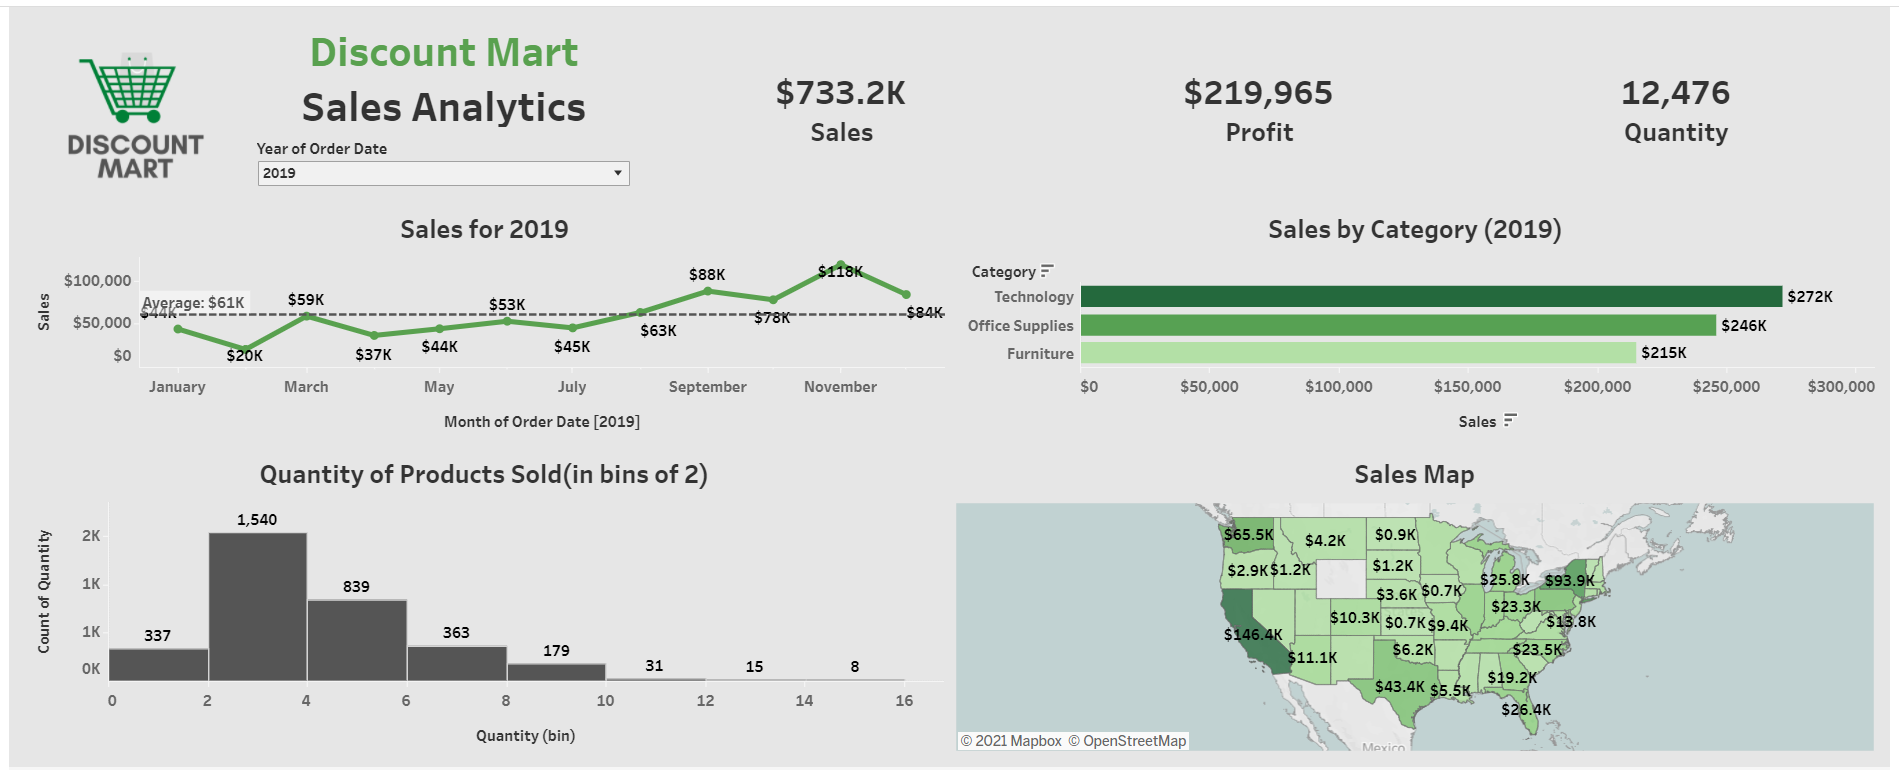
| 1 | Discount Mart Analysis | 1 CSV File | Yes | Viz |
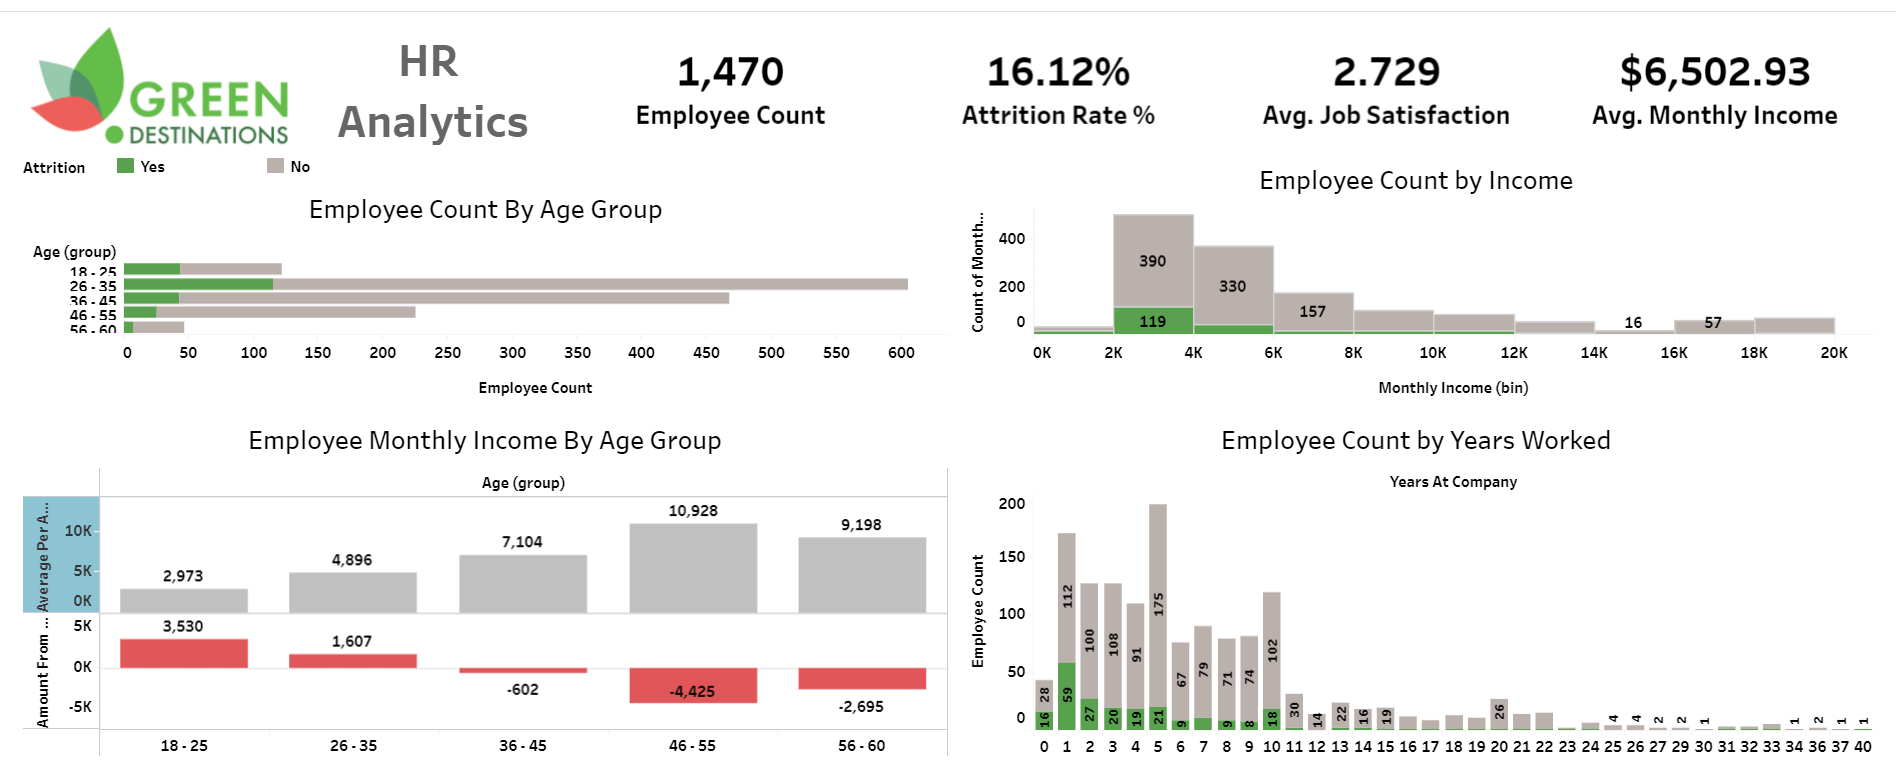
| 2 | Green Destination Analysis | 1 CSV File | Yes | Viz |
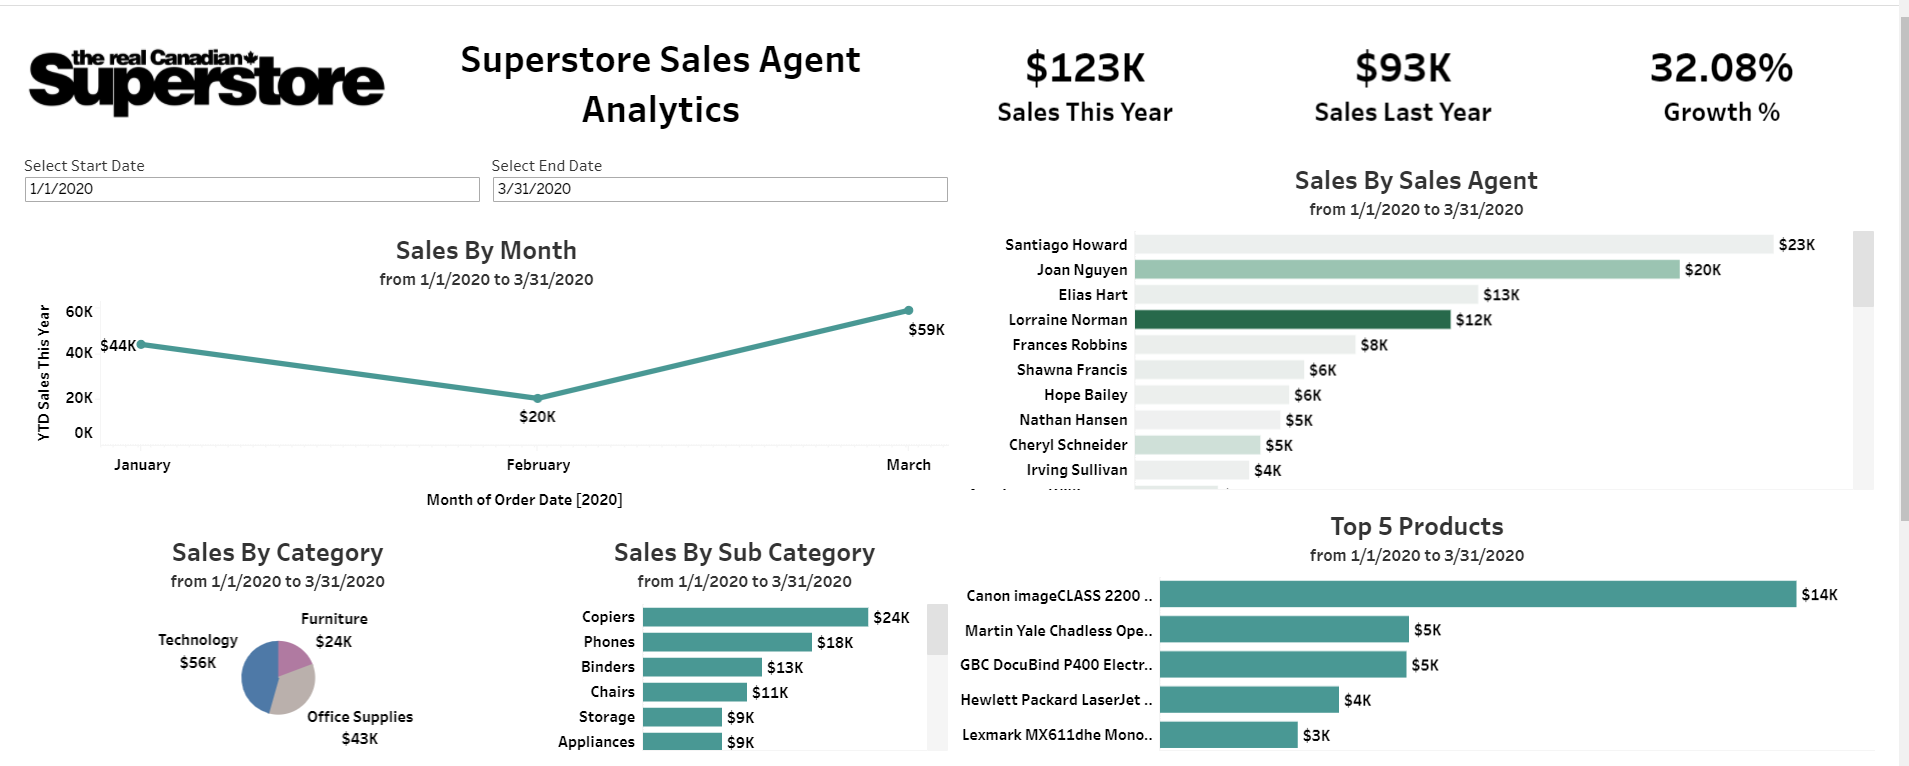
| 3 | Superstore Sales Agent Analysis | 2 CSV File | Yes | Viz |
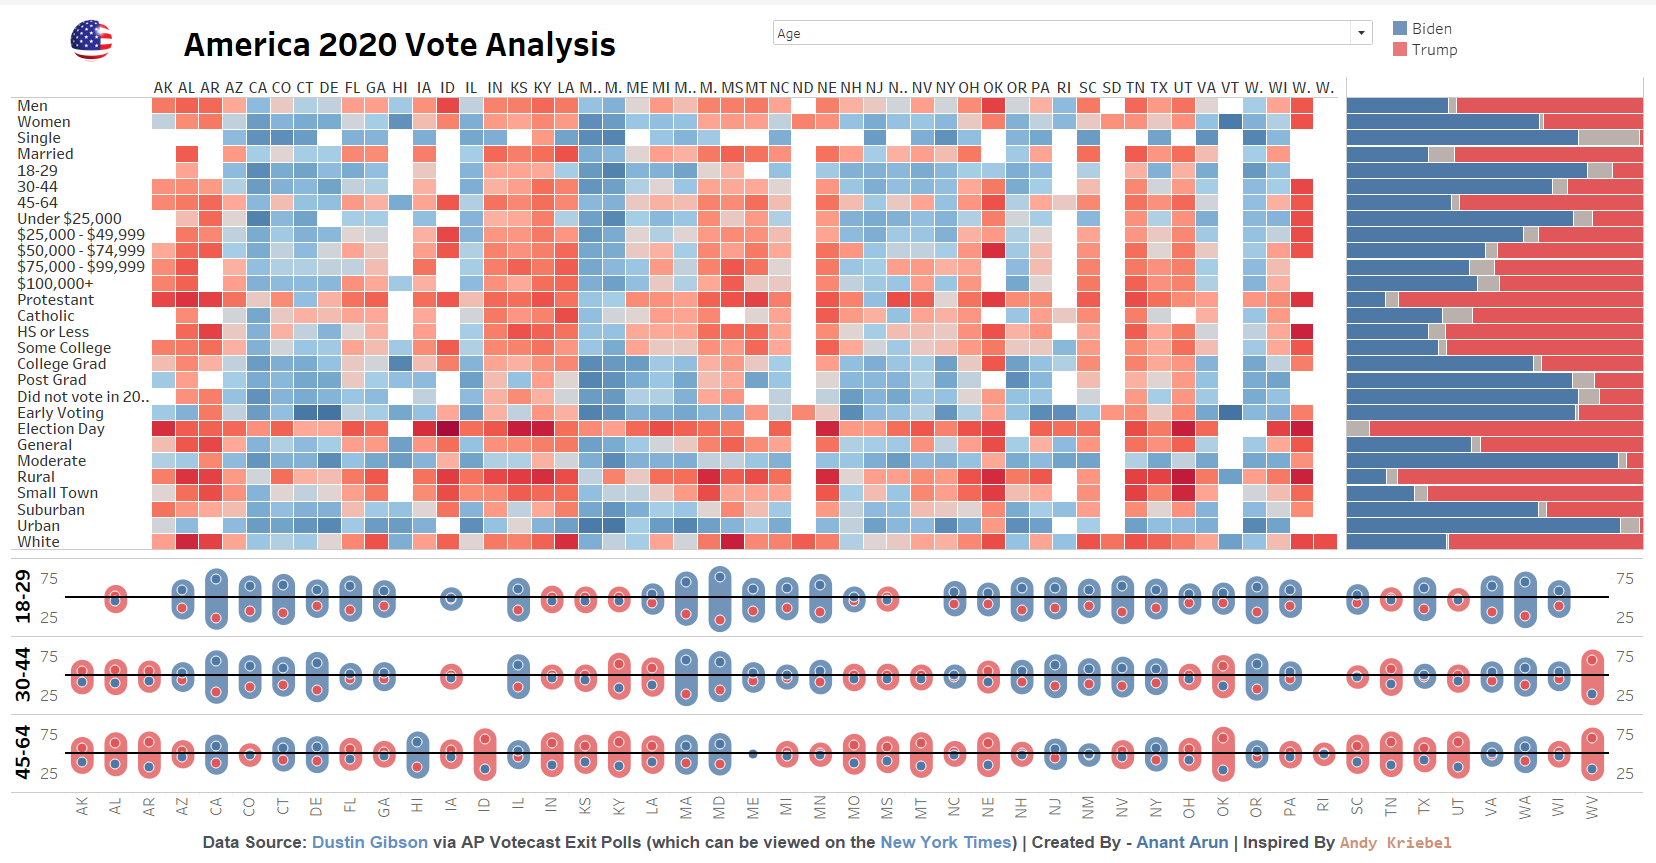
| 4 | America 2020 Vote Analysis | 1 CSV , 1 xlsx file | Yes | Viz |
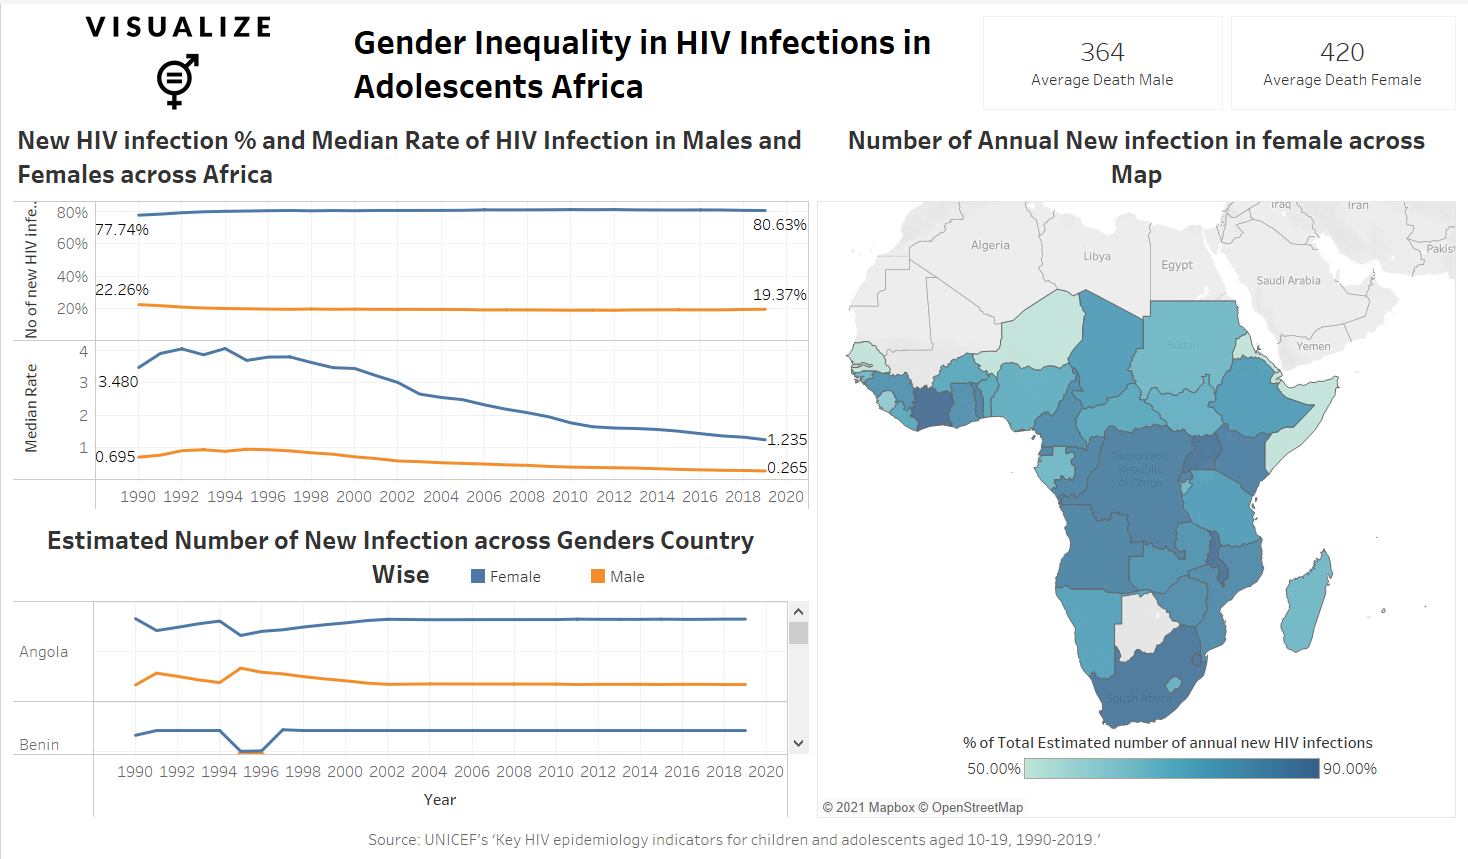
| 5 | Gender Inequality and HIV AIDS Analysis in Africa | 1 CSV File | Yes | Viz |
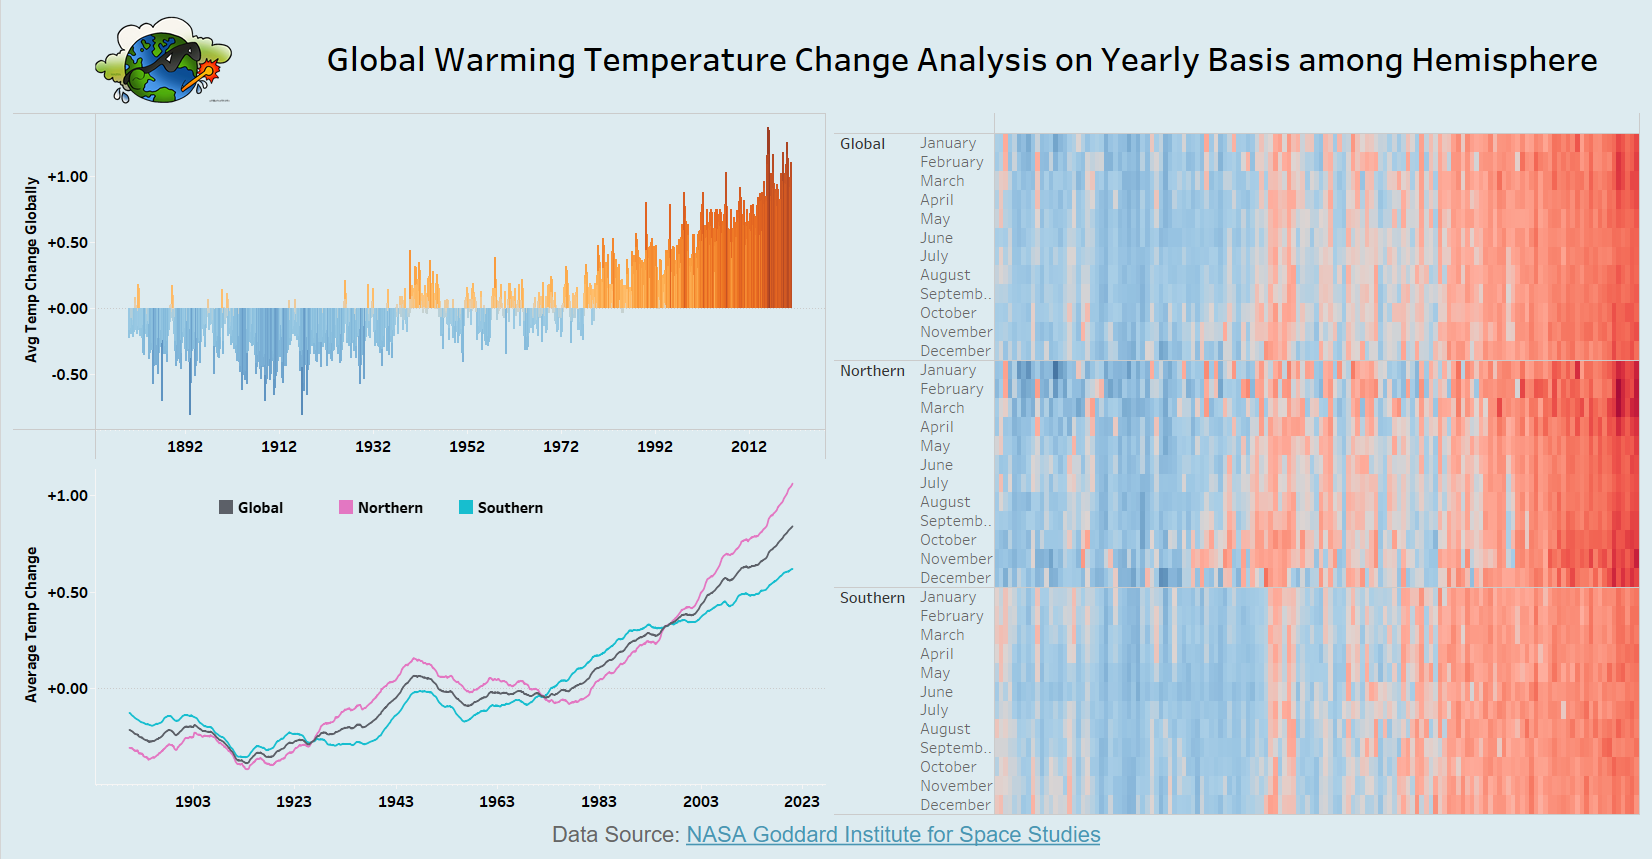
| 6 | Global Warming Analysis | 1 CSV File | Yes | Viz |
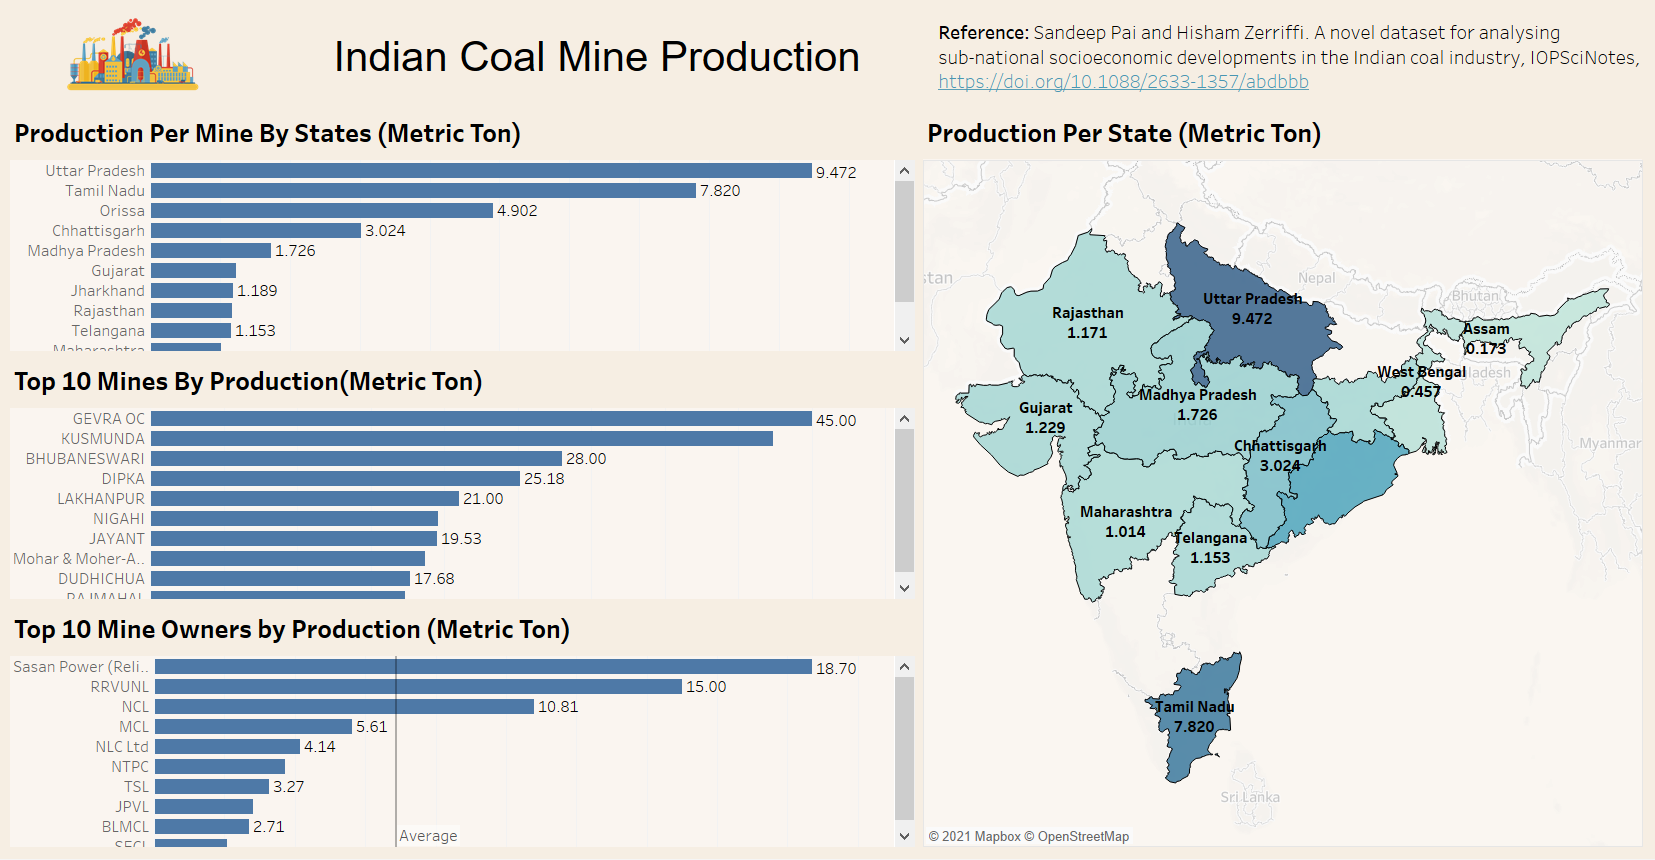
| 7 | India Coal Mine Production Analysis | 1 CSV File | Yes | Viz |
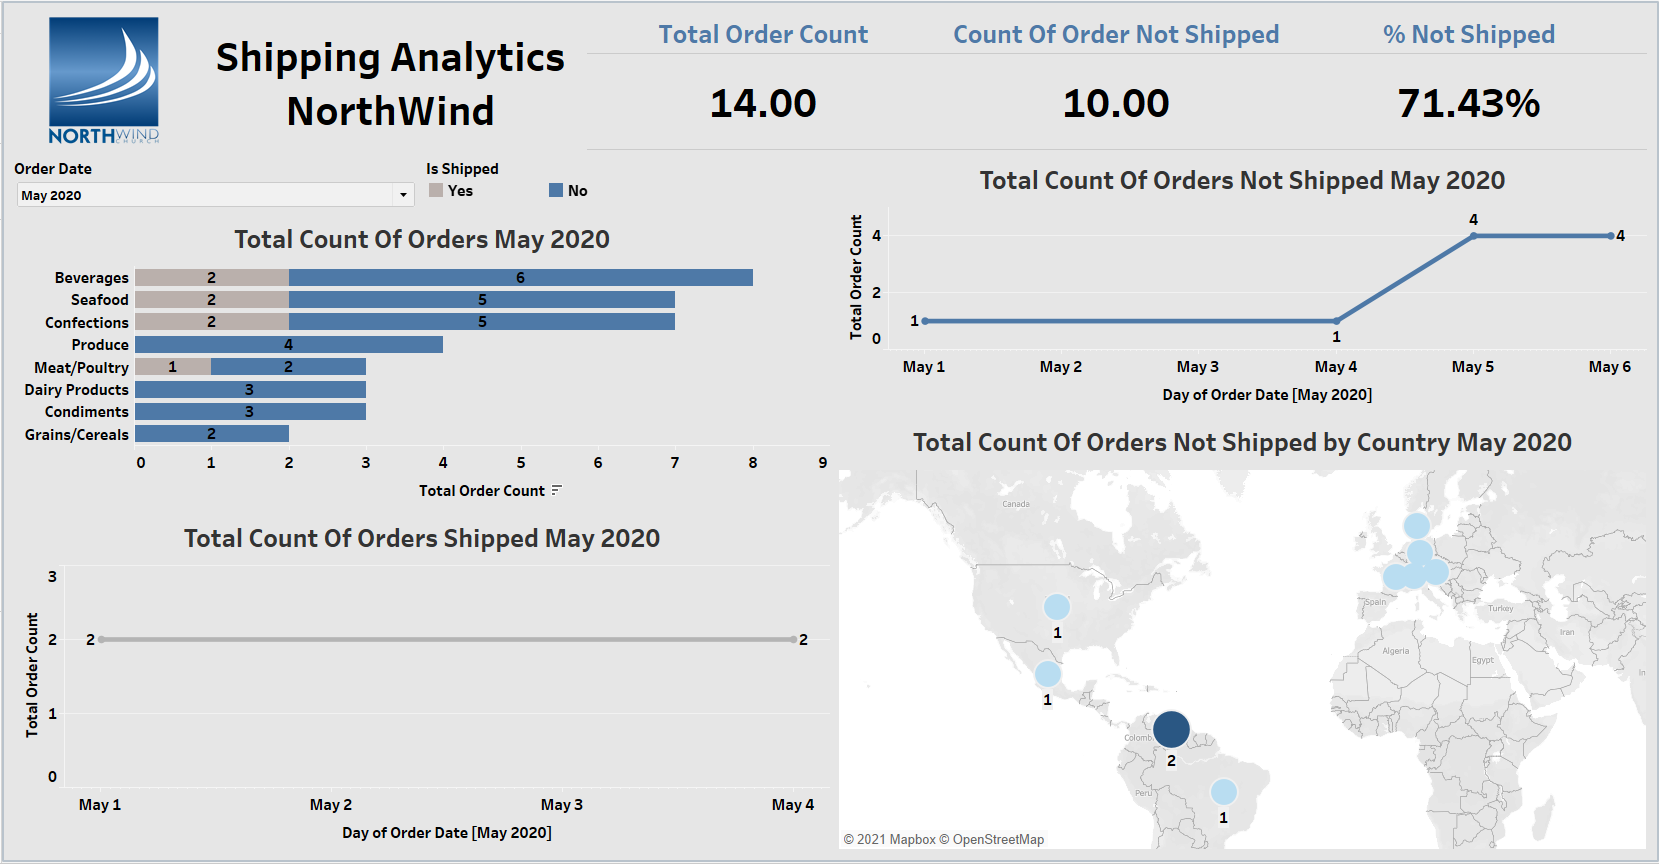
| 8 | Northwind Shipping Analysis | Multiple CSV Files | Yes | Viz |
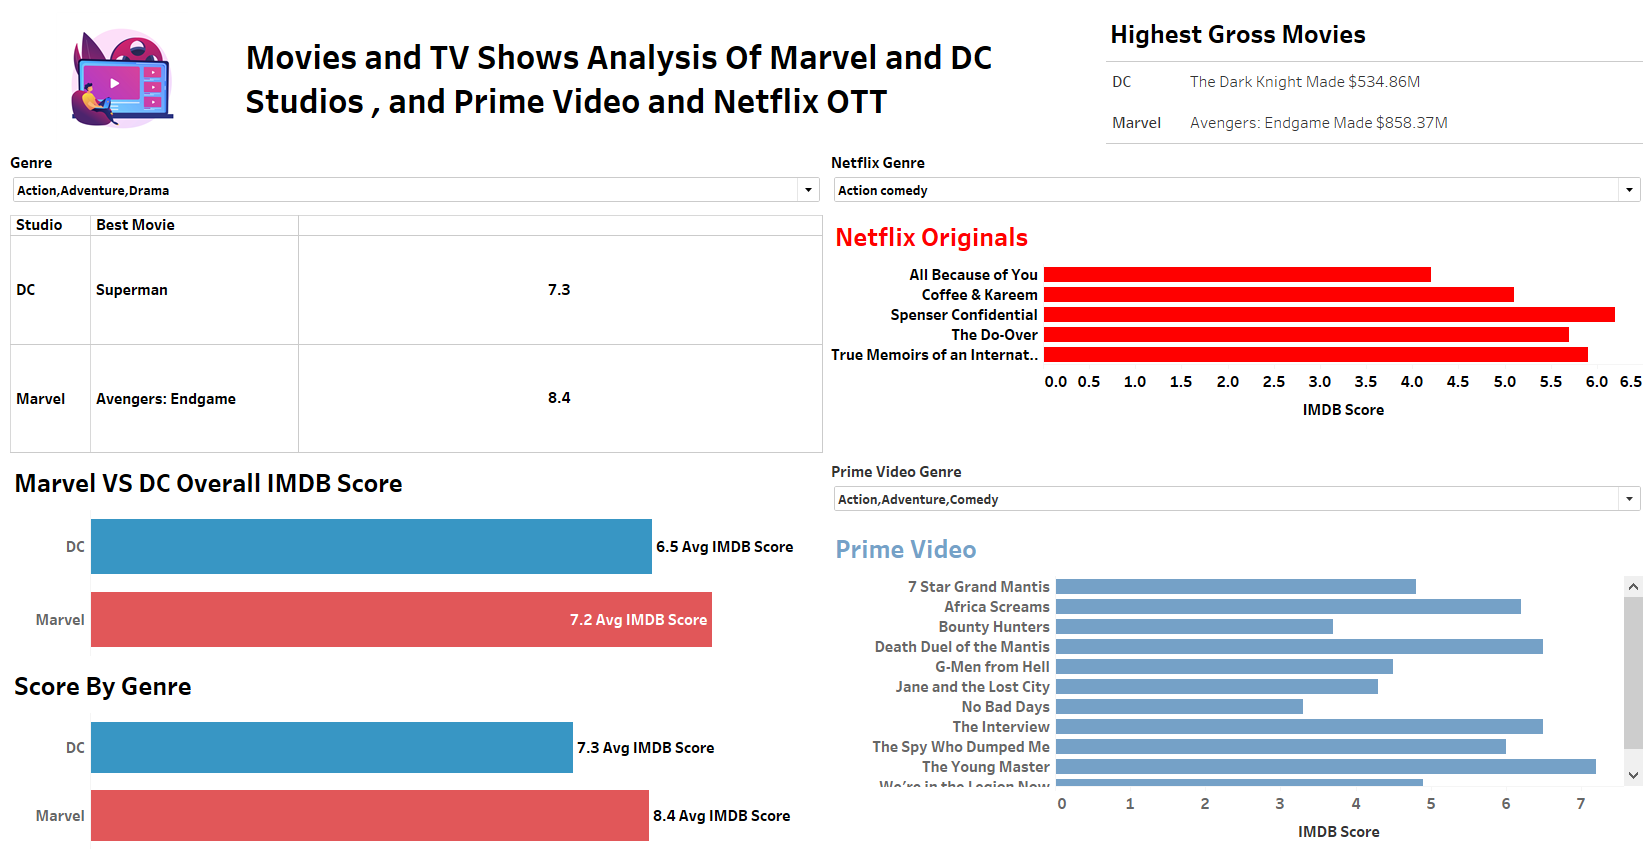
| 9 | Movies and Streaming Platform Analysis | Multiple CSV Files | Yes | Viz |
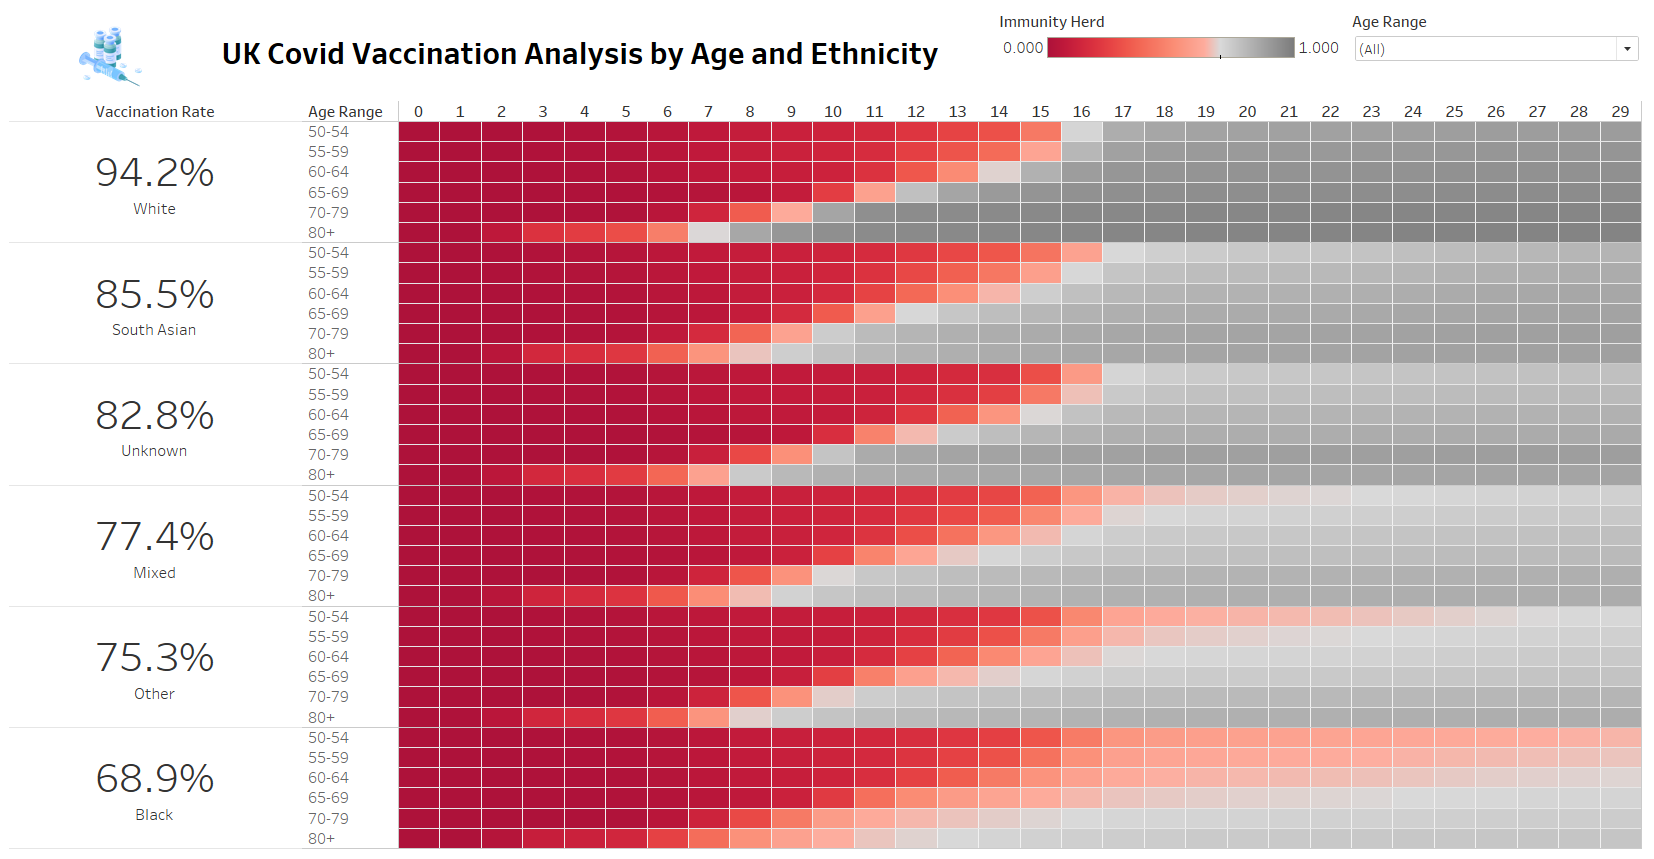
| 10 | UK Covid Vaccine Analysis | 1 CSV File | Yes | Viz |
| 11 | Tesla Stock Price Analysis | Google Sheet Link | Yes | Due to system performance difference , live dashboard may not be visible on some system thus only screenshot provided below. |
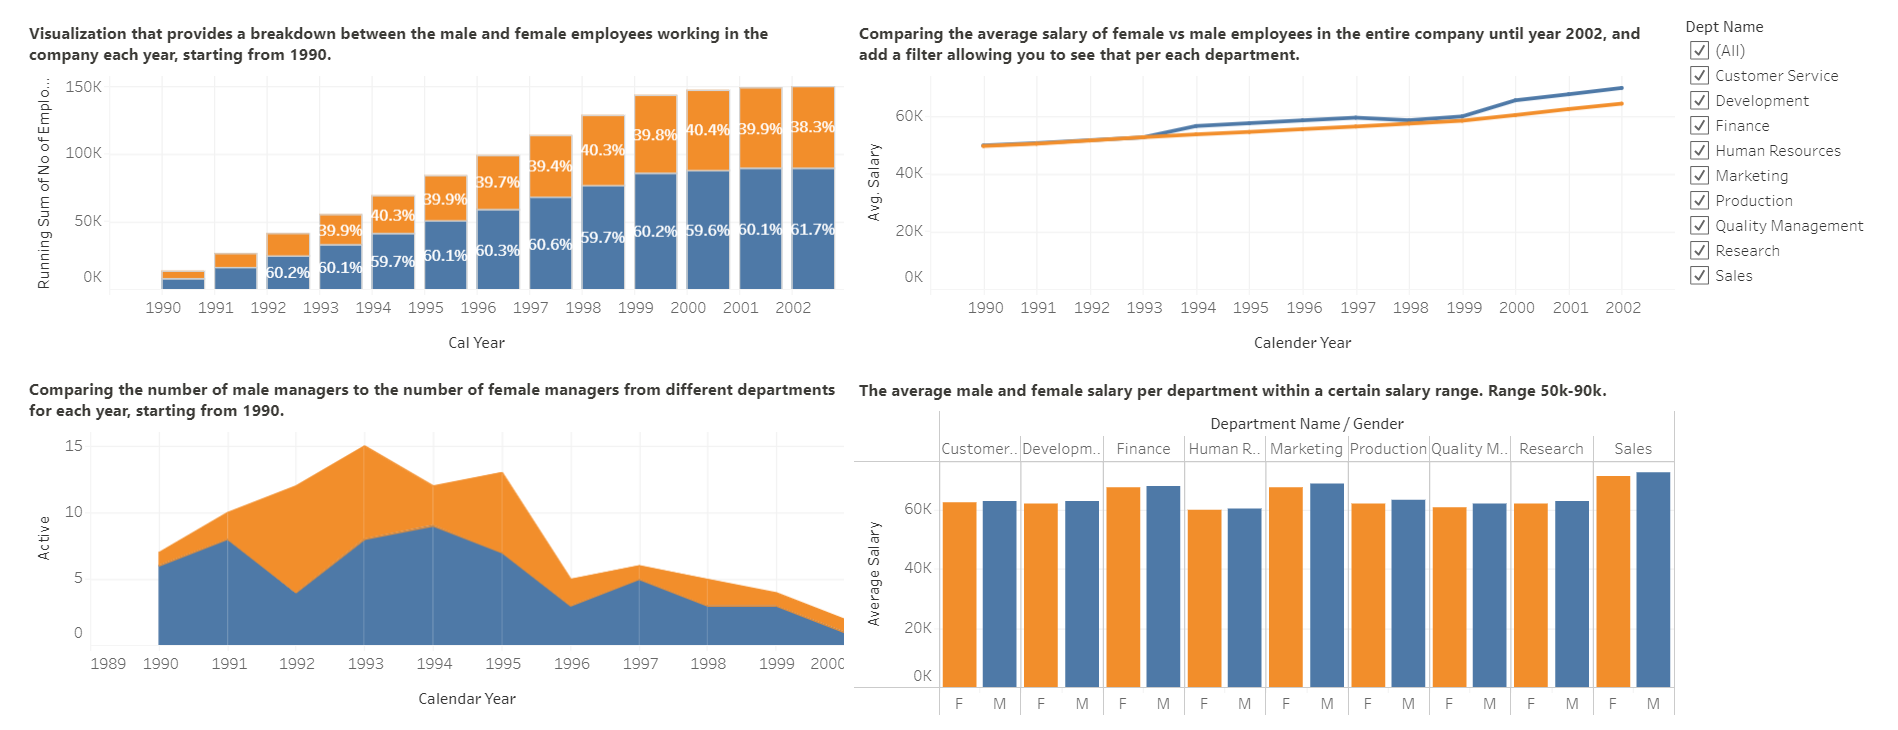
| 12 | Employee Database Analysis | 4 CSV Files imported from MySQL |
No | Viz |
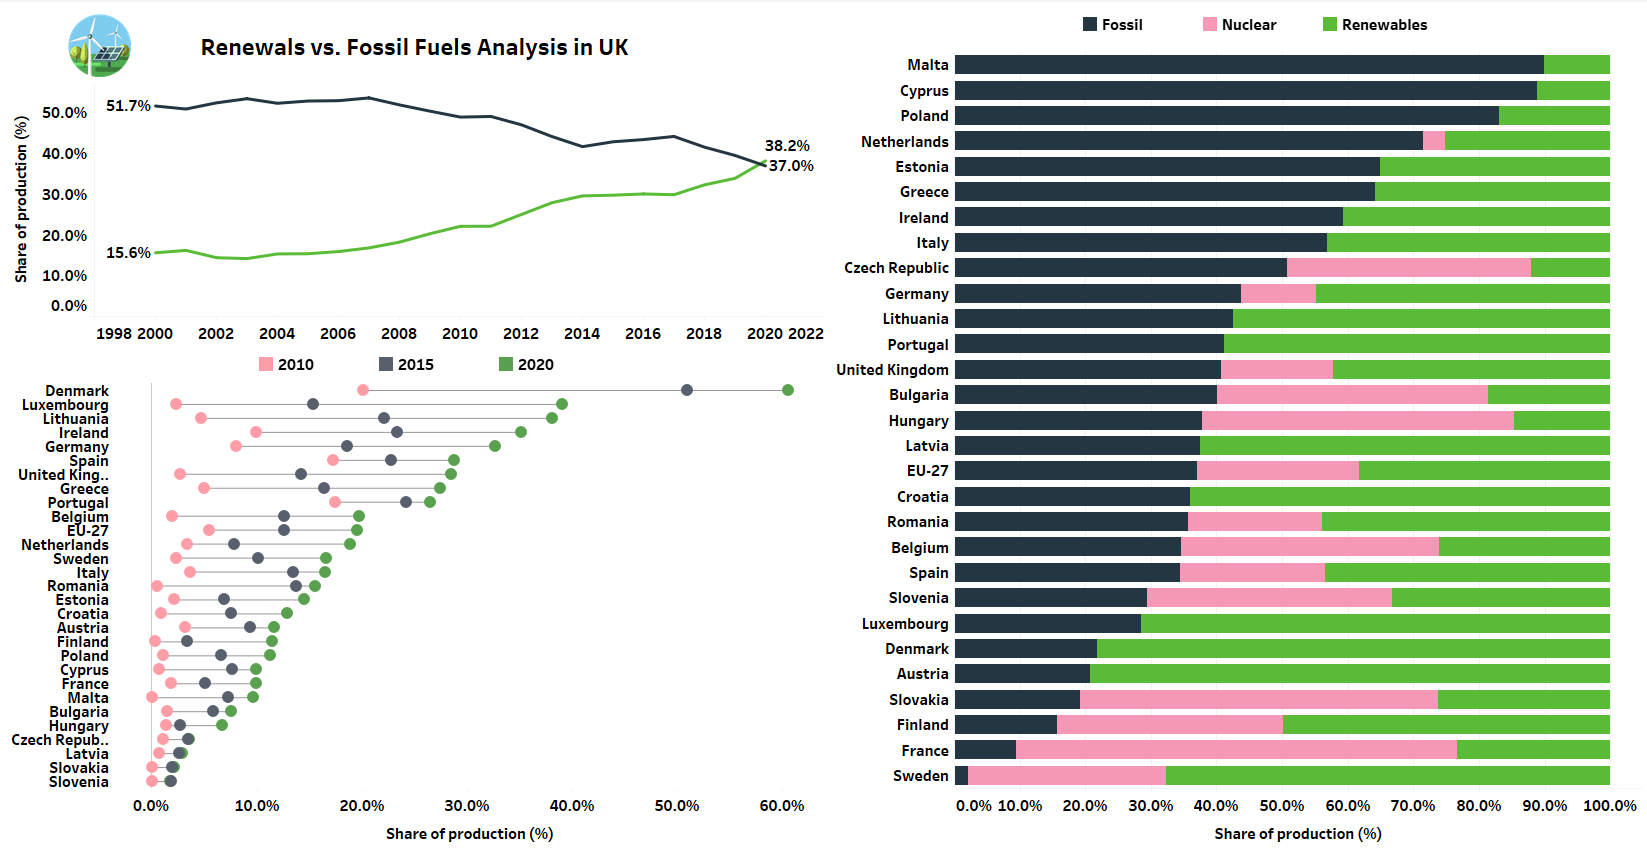
| 13 | UK Fossil Fuel VS Renewable Analysis | 1 xlsx File | No | Viz |
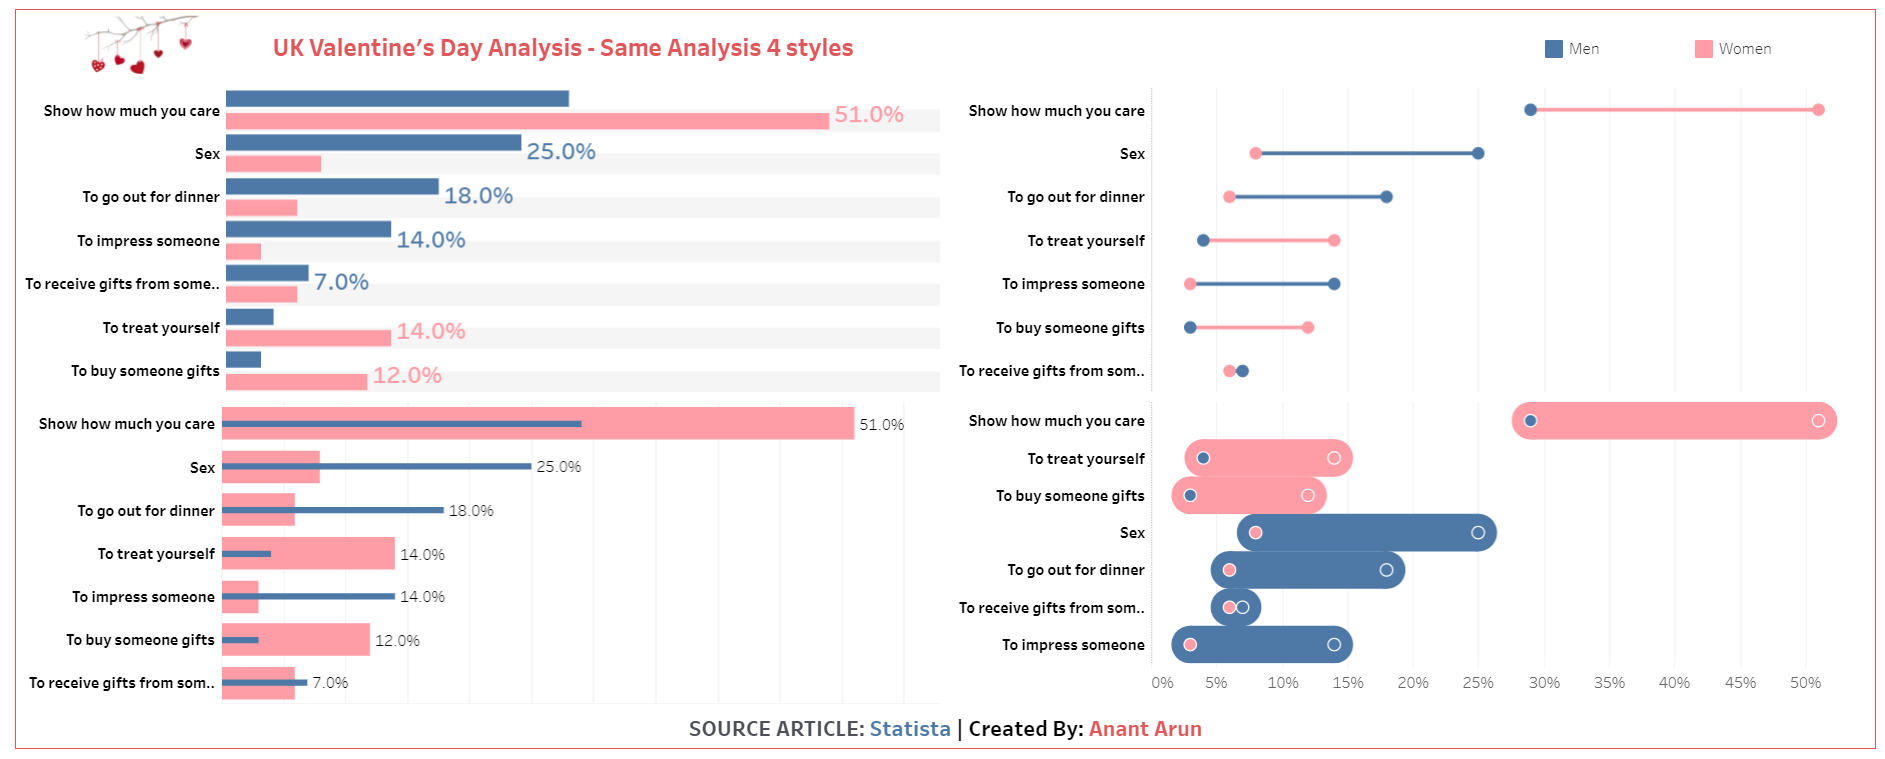
| 14 | Valentines Day Analysis (Signle Analysis 4 Ways) | 1 xlsx File | Yes | Viz |
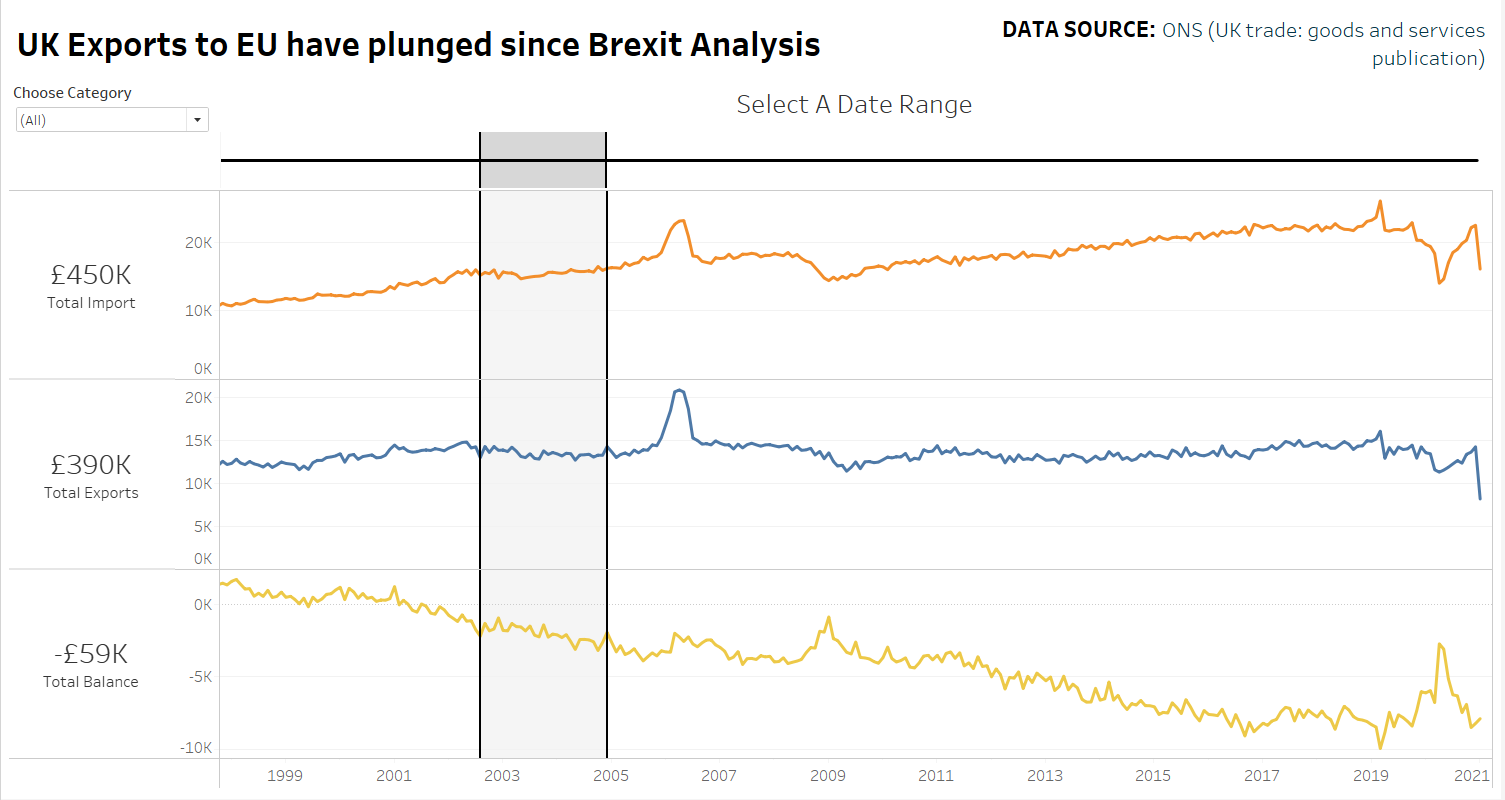
| 15 | UK Export Import Analysis | 1 xlsx File | No | Viz |
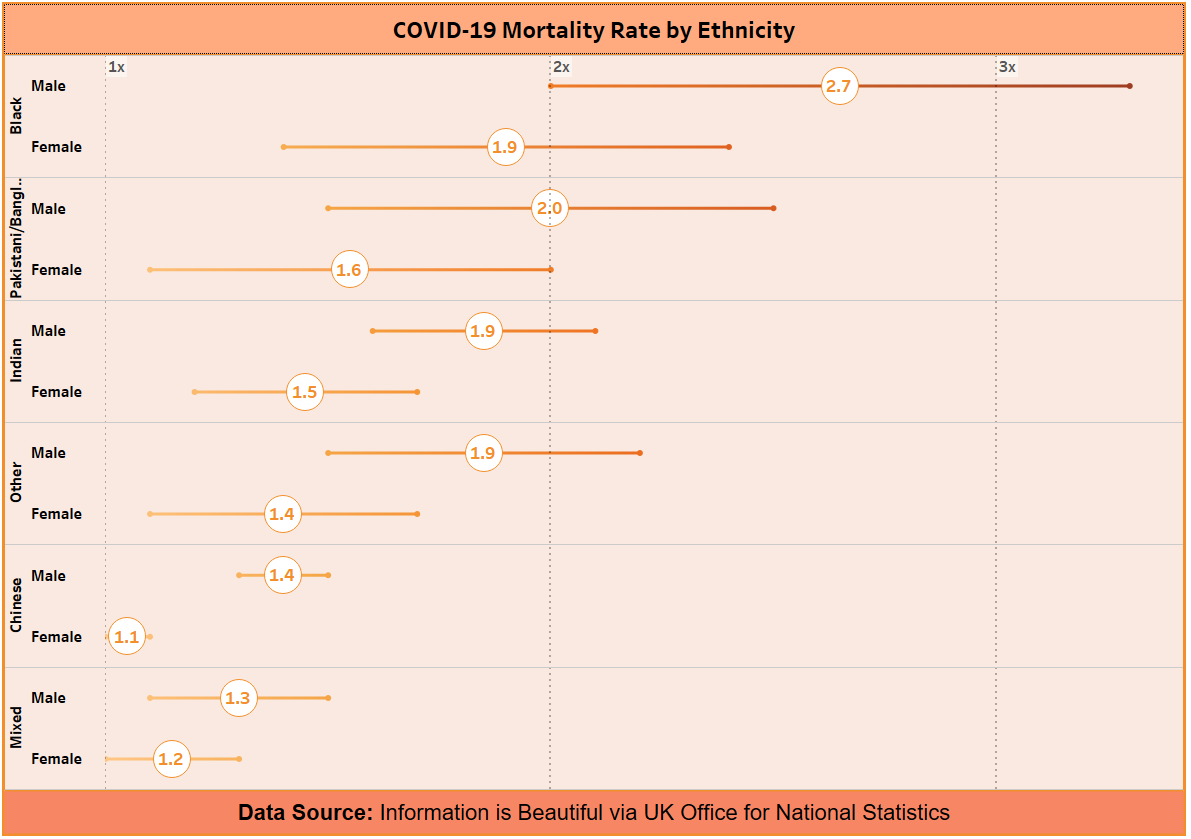
| 16 | COVID Mortality Rate Analysis | 1 xlsx File | No | Viz |
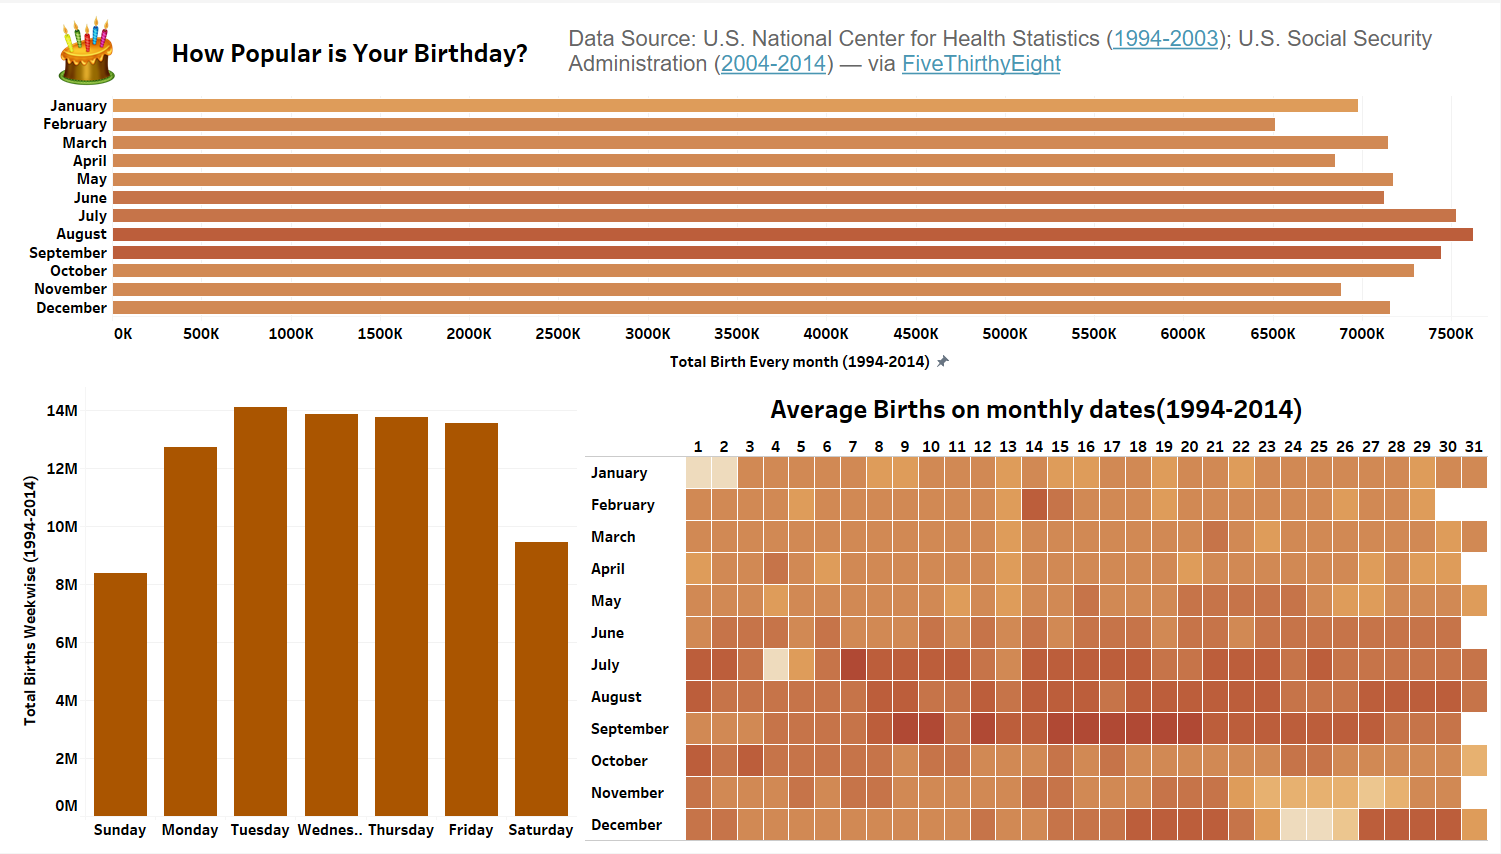
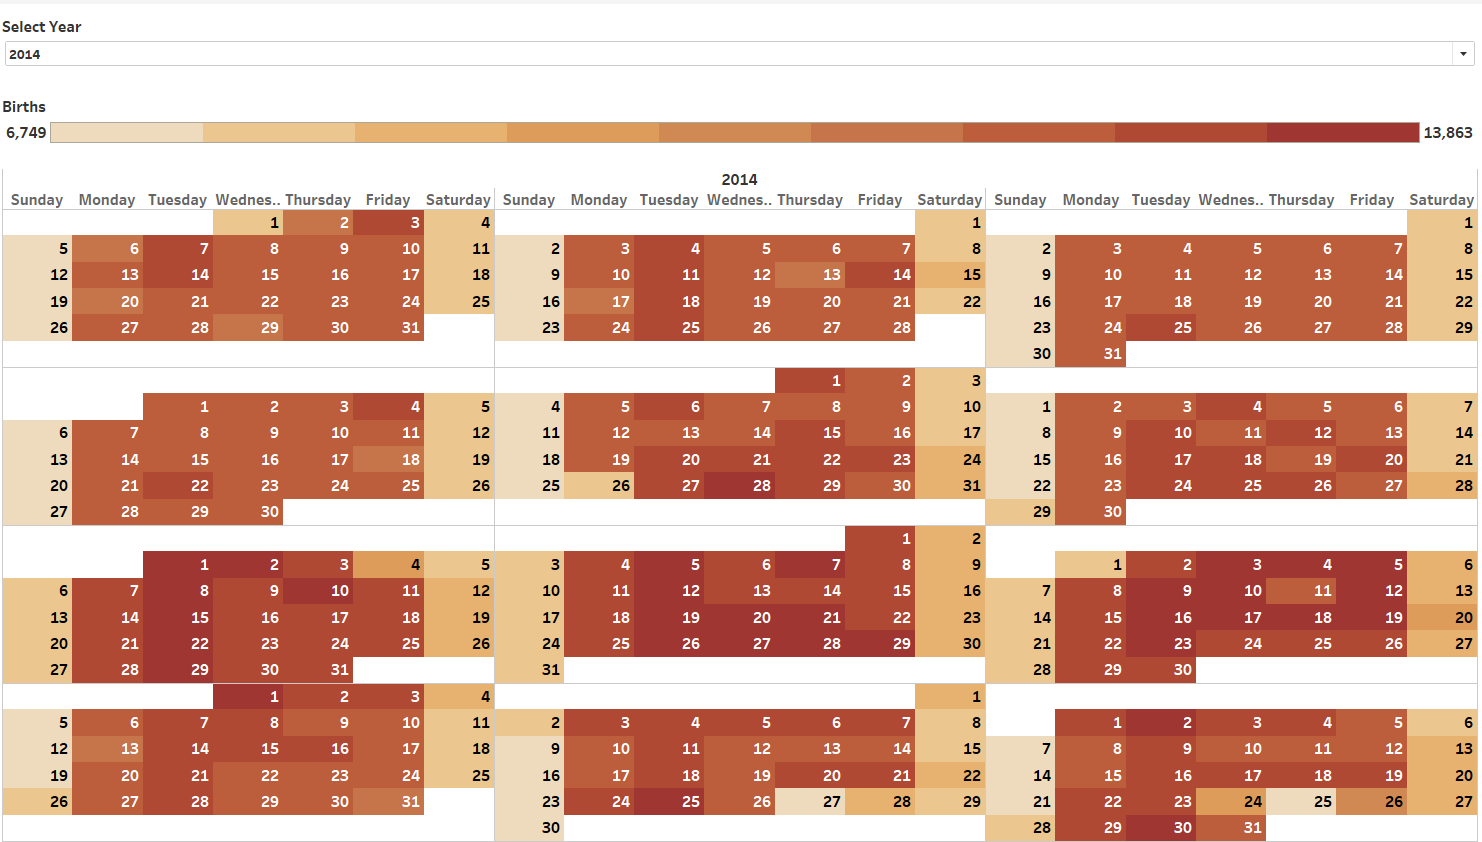
| 17 | Birthday Date Analysis | 1 CSV File | Yes | Viz |
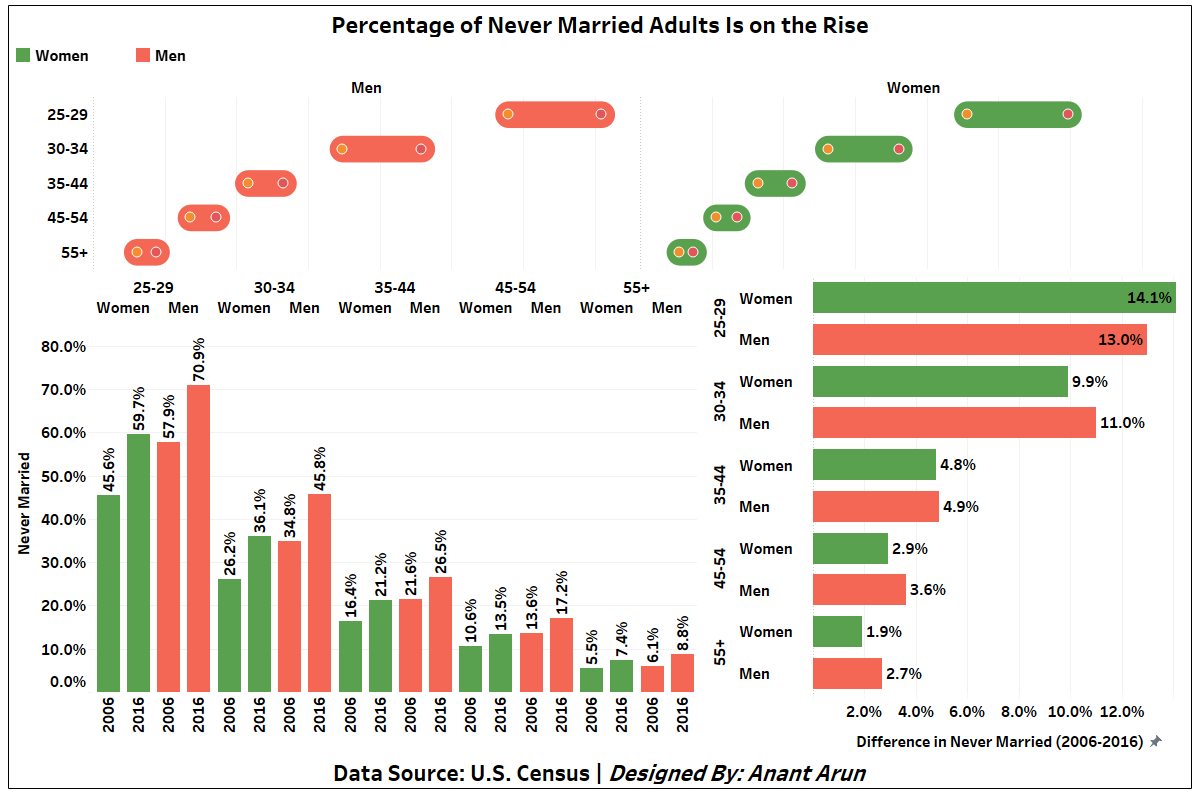
| 18 | US Never Married Analysis | 1 xlsx File | No | Viz |
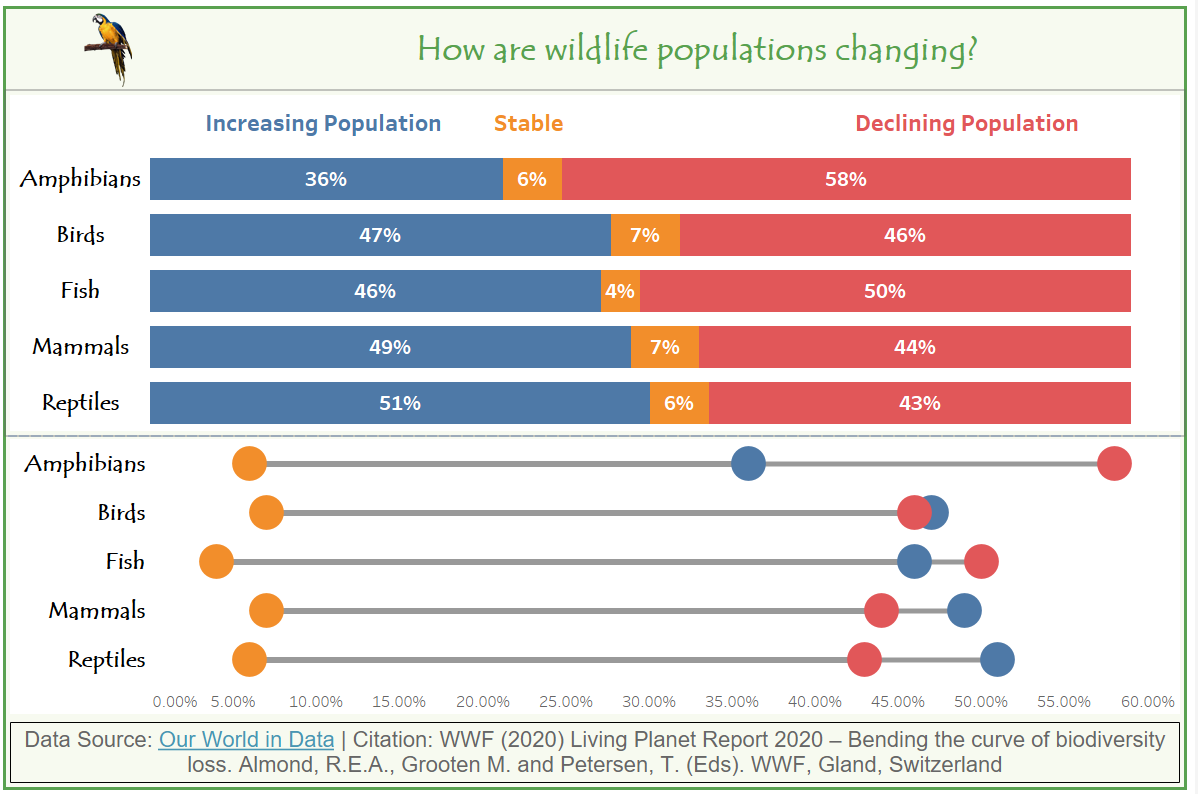
| 19 | Wildlife Population Change Analysis | 1 xlsx File | Yes | Viz |
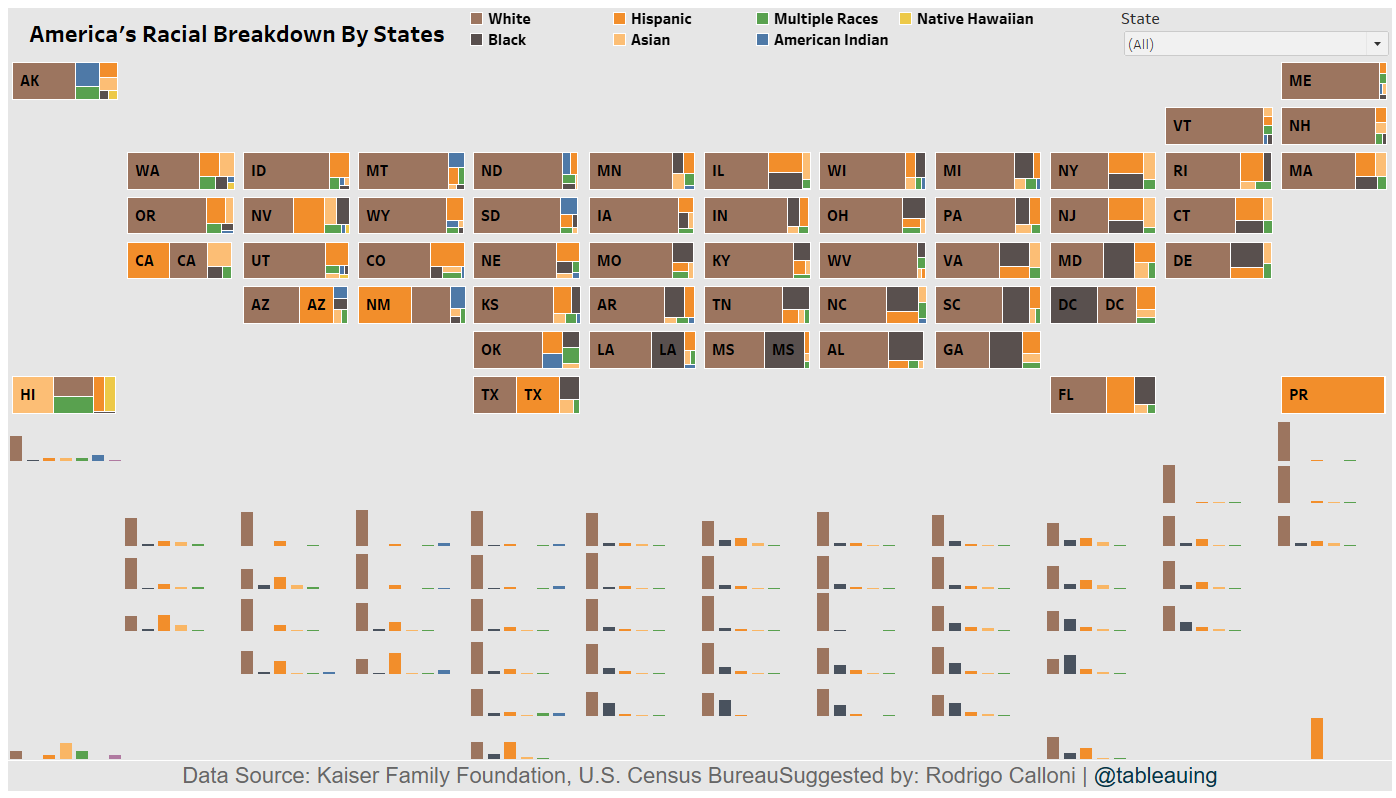
| 20 | US Racial Breakdown by States Analysis | 1 xlsx File | No | Viz |
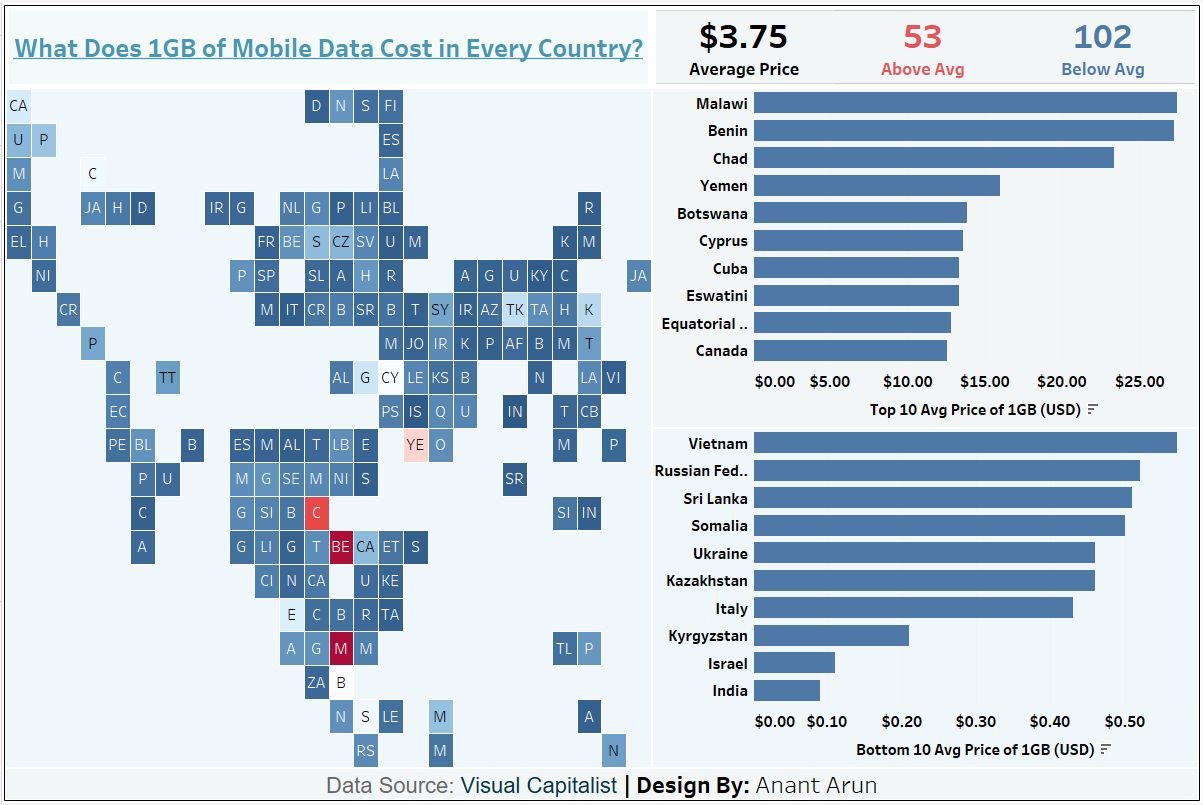
| 21 | World Mobile Data Analysis | 1 xlsx File | No | Viz |
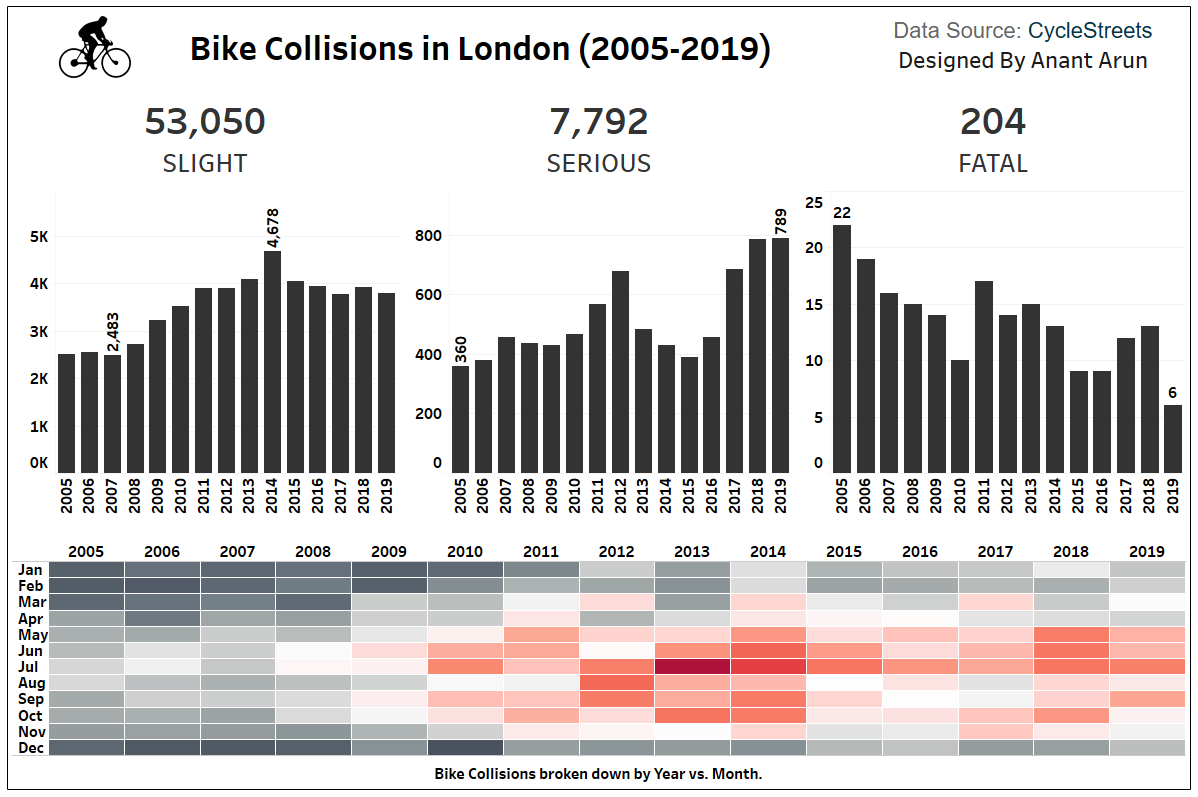
| 22 | Bike Collision in London Analysis | 1 xlsx File | Yes | Viz |
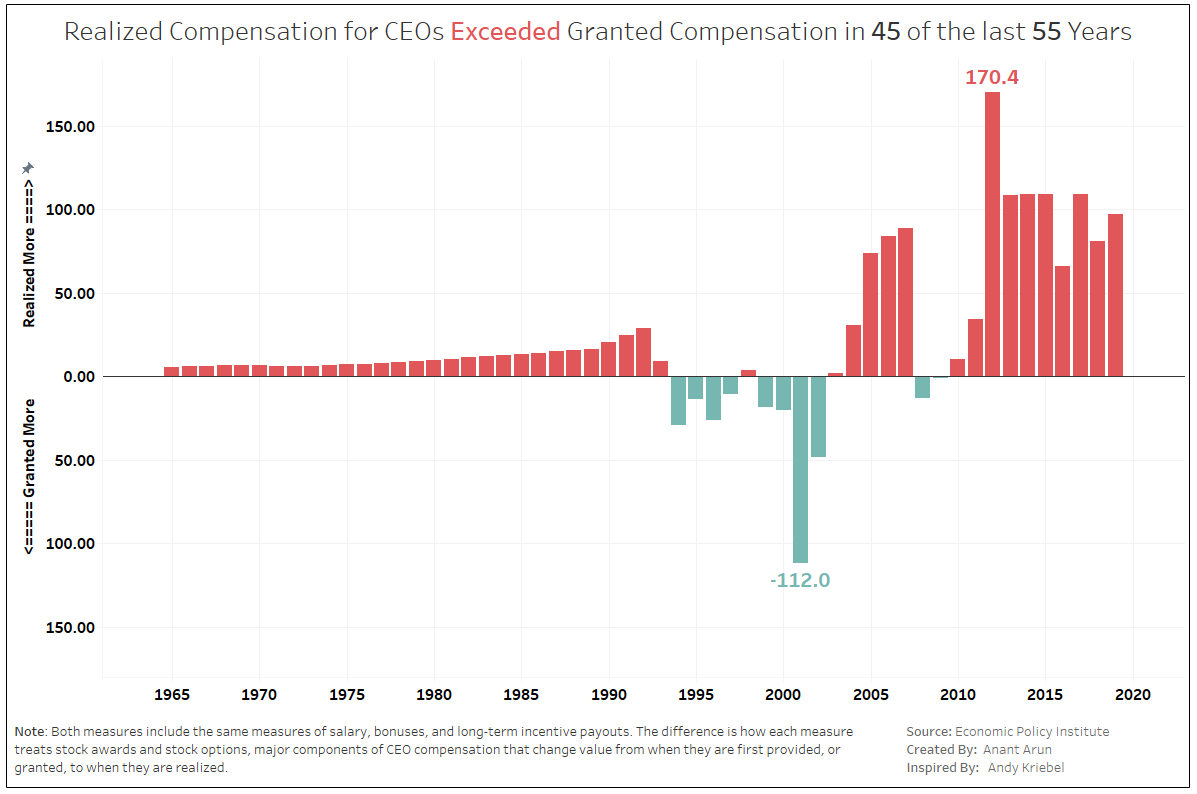
| 23 | CEO-Worker Compensation Ratio | 1 xslx File | No | Viz |
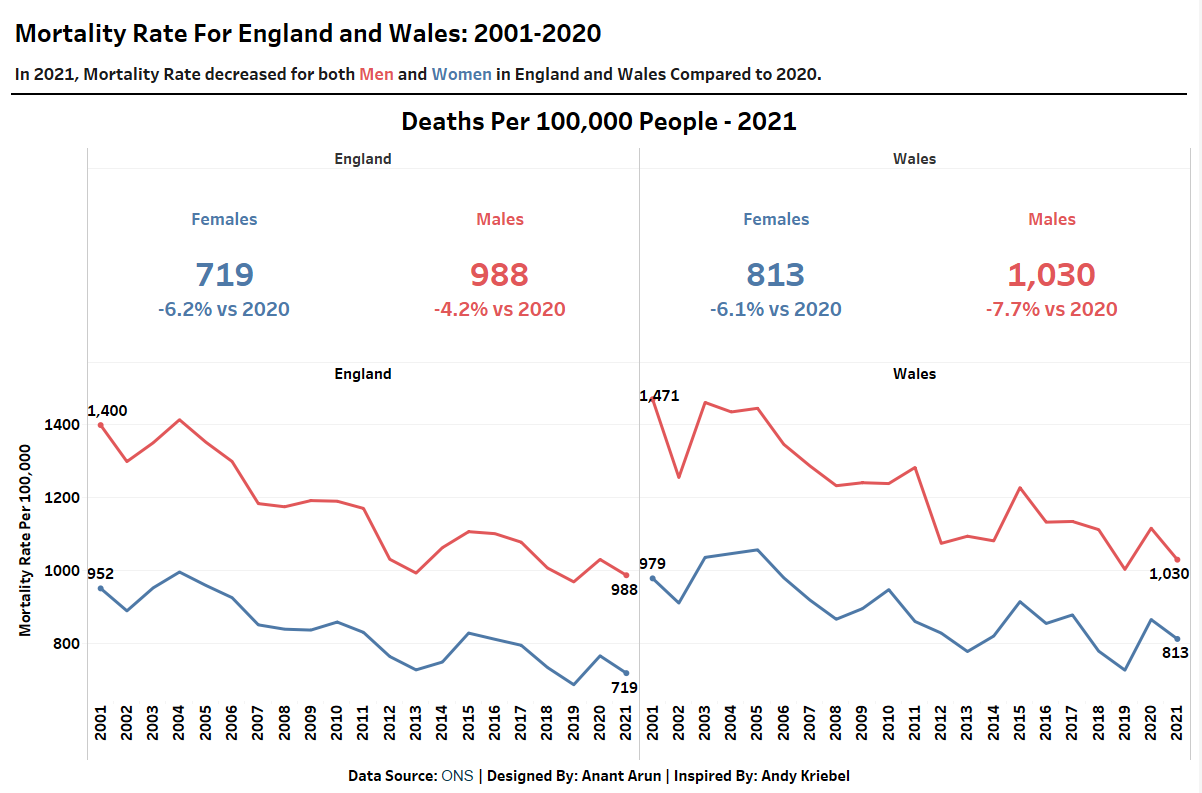
| 24 | Mortality Rate in England and Wales | 1 CSV File | No | Viz |
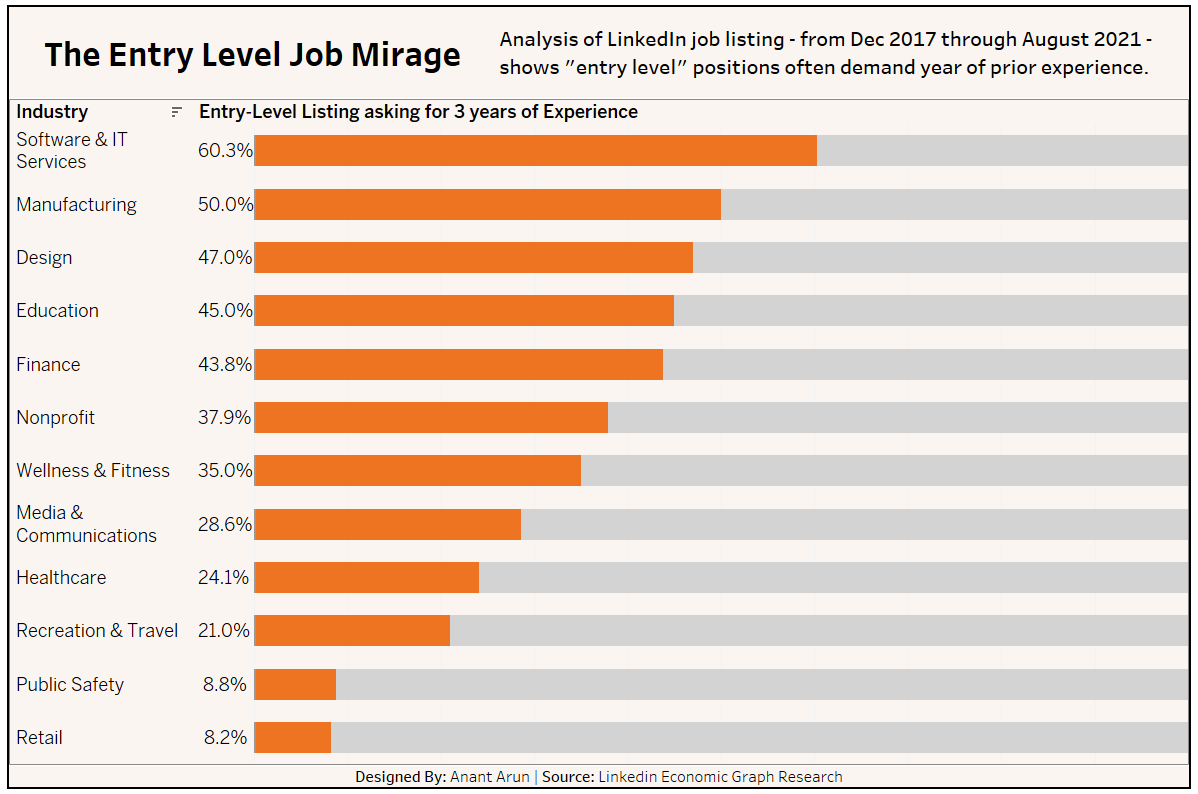
| 25 | Entry Level Linkedin Job Posting | 1 xslx File | No | Viz |
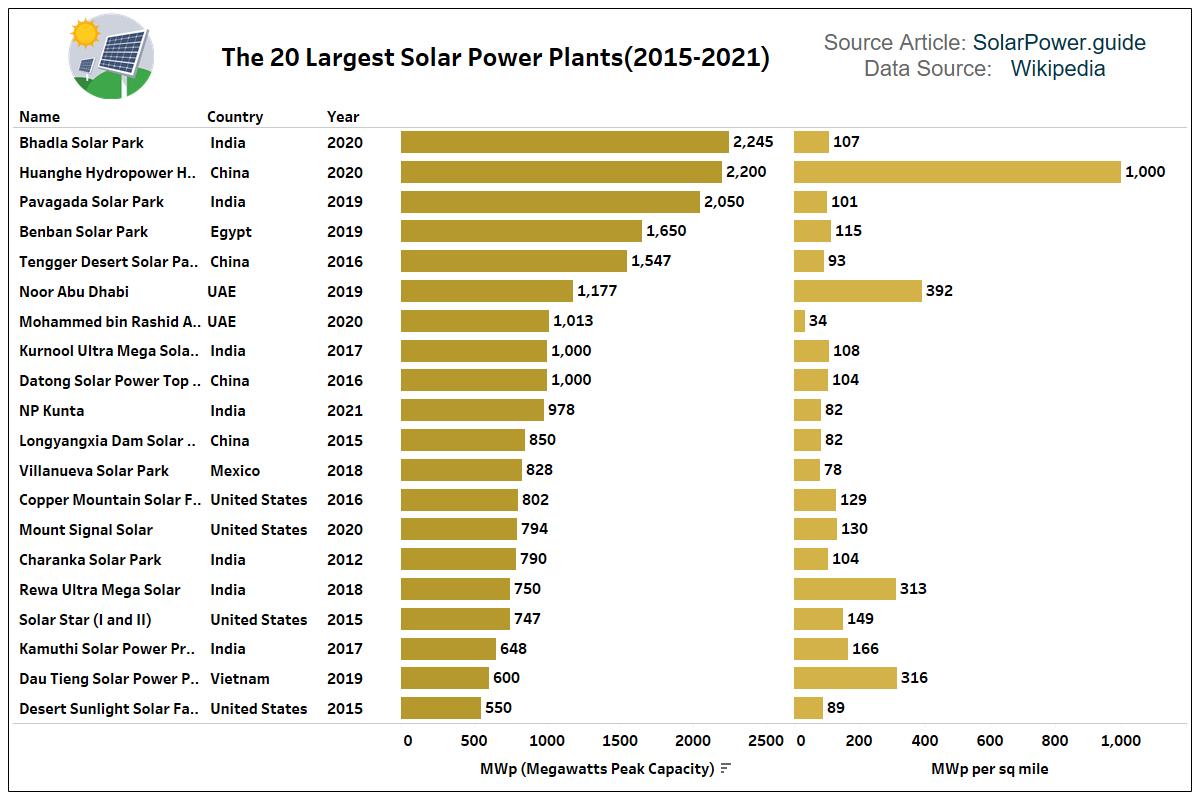
| 26 | Largest Solar Power Plant Analysis | 1 xslx File | Yes | Viz |

- Interactive Dashboards in all Projects
- Dataset Formats - CSV, SQL reports, xslx and web.
- Cross platform Dashboards
- In Multiple Designs & Styles
Software: Tableau Public, Power BI , MySQL , SQLite , Microsoft Excel , Libre Office
Datasets: CSV Files , XSLX files , Database Queries(using MySQL or SQLite)
If you have any feedback, please mail me at anant.arun92@gmail.com
- Kaggle
- GitHub
- Data Budd
- data.world
These folders contains datasets, logos , sql queries and multiple resources which were used to make to the visualization.
Click the Viz Link in Project File Details Documentation Section.
Check Feedback panel.
Few of them have automatic screen adjust but some are fixed due to the data visual adjustments, though all these are perfect for 16.6 Inch screen.
tranparentpng.com , unsplash , freepng.com
It includes resource files used for visualization like tile map.