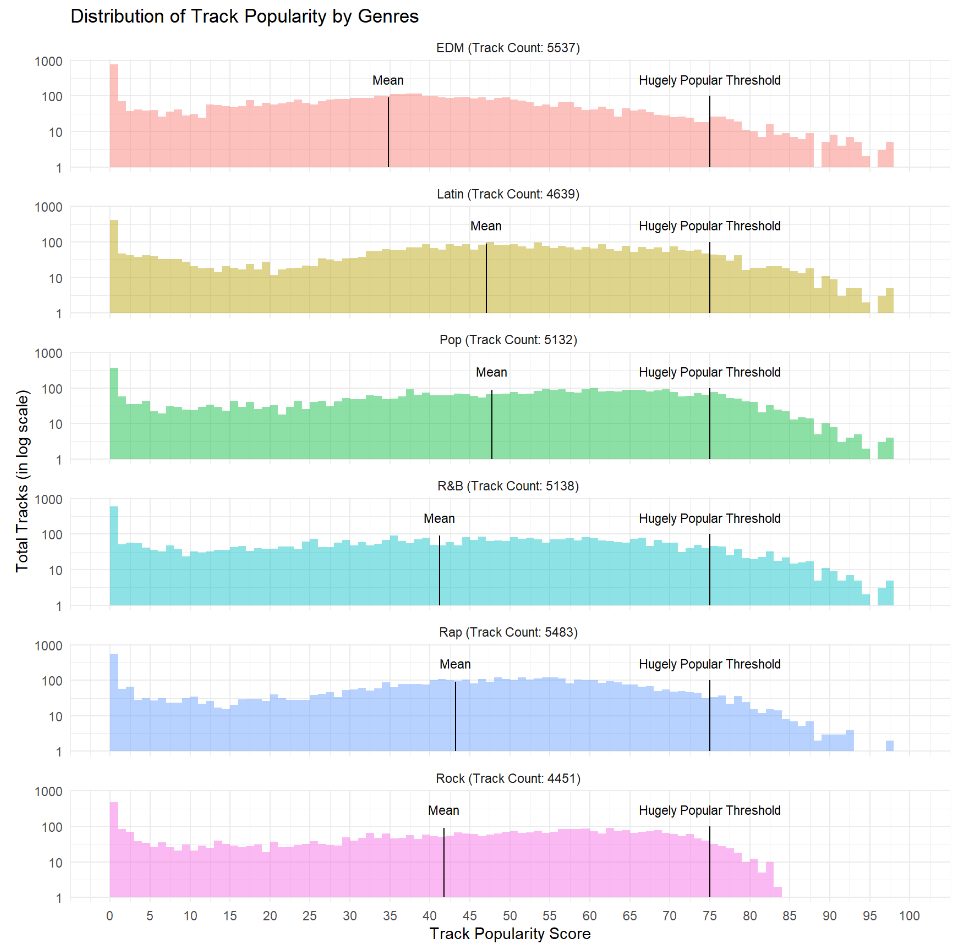
We want readers to see the differences and similarities among the genres’ popularity score distribution. In terms of differences: (1) using the mean line in each genre’s histogram, we can see that, on average, Pop and Latin are the most popular genres (means around 47), and EDM is the least popular genre (mean around 35), (2) Rock did not have many hugely popular tracks, which can be observed by comparing the top tail to the right of the hugely popular threshold line of Rock with the other genres (where Rock decreases sharply before 85 as opposed to the other genres). In terms of similarities, trends-wise, we can see that all the genres have a similar distribution: (1) a general increase as popularity approaches the mean value, (2) a steep fall at popularity > 75 (there exist only few hugely popular tracks), (3) the domination of very unpopular tracks with “near 0” (“~0”) popularity (as seen from the surprising sharp spike at the left tail end). However, one thing not exactly obvious from the graph due to the log scale on y axis is the true number of 0-popularity tracks, which might mislead readers to think that the number of 0-popularity tracks for each genre is quite similar, when in fact, they are not (EDM has roughly twice the number of 0’s compared to Pop and Latin, but they look equal in the histograms). As the number of tracks in each genre is roughly balanced (ranging from 4451 to 5537 tracks), more 0’s leads to a lower mean; this might explain why the mean popularity of EDM is the lowest, while those for Pop and Latin are the highest.
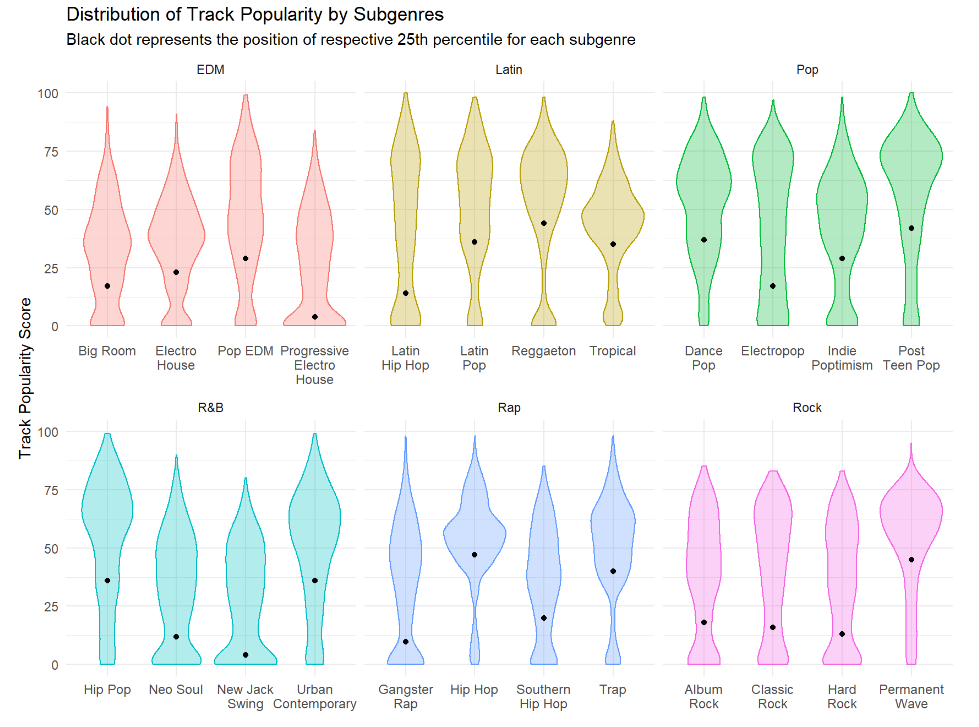
From the second graph, we want readers to observe how each subgenre affects the popularity score distribution of its respective genre, which can be done by looking at the unique shape of the corresponding subgenre’s violin graph. Some of them have greater weight at the lower popularity score values, some are top-heavy, while others are quite equally distributed. The point inside each violin graph indicates the 25th percentile of the distribution to show the position of the lower tail of each subgenre’s distribution. By looking at the violins’ generally bulky lower tail and the placement of these 25th percentile points, one trend that we can see is that for most genres, one or two subgenres usually contribute to the domination of “~0” popularity score. However, a trend that cannot be observed from these graphs is the true number of 0-popularity tracks in each subgenre due to the smoothing function used for constructing the violin graphs, but this should not be an issue since we are focusing on the “~0” popularity tracks. Moreover, by looking at where each violin graph is the widest, we can see the peak(s) of the unimodal or multimodal distribution across subgenres. From these peaks, two trends we can observe are: (1) the subgenres in EDM have the most lower-valued popularity score peaks compared to other genres, (2) subgenres with the word “Pop” inside, regardless of the genre, have peaks in the high popularity region.
We speculate that the distributions in the two visualizations look this way because the majority of tracks in this Spotify dataset were published pre-2020. Since popularity score was considered in 2020 and tracks tend to become less popular as they age, it results in a lower popularity score mean across all genres (< 50). We also assume that the vast difference between the share “~0” popularity tracks and hugely popular tracks are due to most listeners preferring to listen to already popular artists or well-known tracks rather than listening to lesser-known tracks. Since the dataset is a sample of actual Spotify data in 2020, it is also understandable that the trends observed from our visualizations may not necessarily reflect true trends in the music industry. For instance, from our first visualization, we see that Rock tracks are not as popular as other genres’ tracks in 2020. We speculate that it is because this dataset only contains 4 subgenres of Rock, which are Album Rock, Classic Rock, Hard Rock, and Permanent Rock, but there are more popular subgenres of Rock not included in the dataset, such as Alternative Rock, Rock ‘n’ Roll, Indie Rock, and Progressive Rock [3].
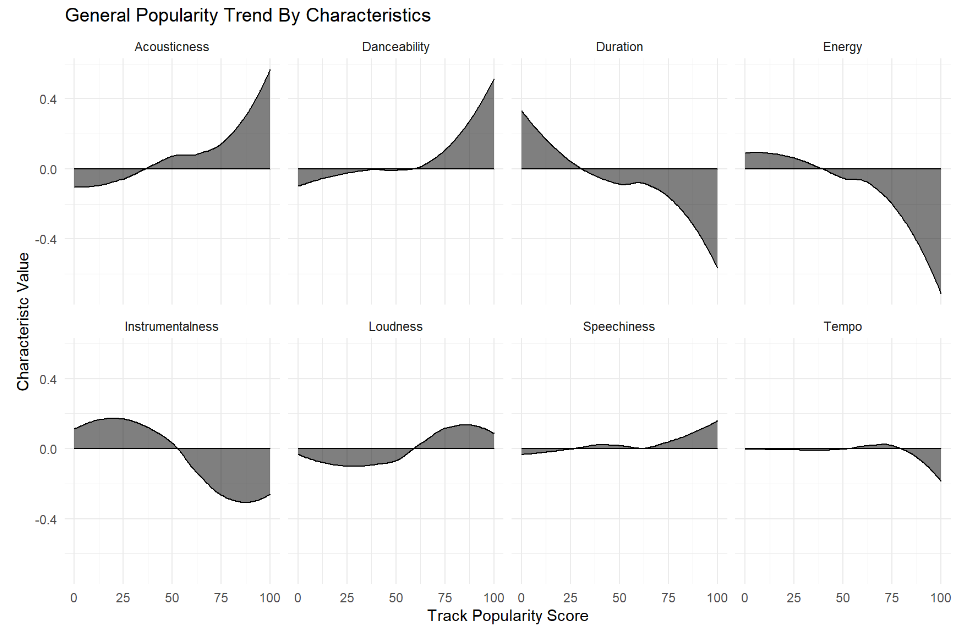

From the first graph, we hope that readers can recognize popularity trends for each of the 8 track characteristics. Through the curves’ outlines, we see tracks that are better received by the public have lower than average values for duration, energy, instrumentalness and tempo, in contrast with higher than average values for acousticness, danceability, loudness, and speechiness. With the pattern shown, we made some speculations about why the trend looks the way it does, such as (1) the rise of TikTok in 2020 as a dance video-sharing app [4] allows high danceability tracks to gain more exposure resulting in higher popularity, (2) our declining attention span over the years [5] has resulted in tracks with longer durations to become less popular. However, one thing not well-reflected in the graph due to the smoothed function is the deviation of some points from the general trend, but this should not be an issue as we only want to show trends of the general public taste.
From the second visualization, we hope readers can see the overall characteristics of each of these top 5 artists’ tracks and compare them with the general public’s taste. In each radar chart polygon, each vertex corresponds to the mean value for each characteristic in the artist’s tracks, and the 0-ring represents the mean value for each track characteristic in the Spotify dataset; the further the point’s distance from the 0-ring, the greater the track characteristic’s deviations from the mean. Generally, we observe that the majority of the polygon’s borders lie in the space between the 0-ring and (-1)-ring (representing values less than 1 standard deviation from the mean); hence, many of these artists’ track characteristics tend to be similar and slightly lower than the Spotify dataset’s average. However, one thing is not well-reflected in our visualization: the true value for each characteristic e.g. we see a value lying between 0-ring and (-1)-ring, but we cannot know its exact value due to the earlier-performed normalization. Although this conceals the complexity of each characteristic’s actual values, since we are only interested in how much they are used in the artists’ tracks, this should not be an issue.
Furthermore, looking into each polygon, we can better understand the characteristics of each artist’s tracks. For instance: (1) AC/DC tracks are low in acousticness and danceability, but their duration and energy are higher than average; which deviate from the trends observed in the first visualization of popular tracks being high in acousticness and danceability, but low in duration and energy. (2) for Billie Eilish’s tracks, acousticness is significantly higher (by 2 standard deviations) than the mean, whereas energy and loudness is significantly lower (by 2 standard deviations) than the mean; the exceptionally high acousticness and low energy in Billie Eilish’s tracks align with the trend for popular tracks, however, it is not the case for loudness. We speculate that (1) the 4 distinct characteristics in AC/DC tracks are their uniqueness which enabled this 1973-formed band to shine in the music industry for more than 30 years [6], and (2) the 3 extreme characteristics in Billie Eilish tracks are Billie Eilish’s distinct musical style that sets her apart from other artists and captivates listeners [7] . Similar observations can be made through the other three artists’ radar charts, where some of their tracks characteristics’ values deviate from the trends for popular tracks. We attribute these deviations to each artist’s individual musical style which, despite its differences from the general public’s taste, is still well-received, thereby placing them in the top 5.