Kickstarter is a crowdfunding platform that focuses on funding for new creative projects. Kickstarter examined over four thousand different campaigns globally with a focal point in the entertainment industry (film, theater, music, games, video, and photography).
The purpose of the analysis was to assist the customer in making an informed decision on when to launch, and where to start a crowdfunding campaign. Although the platform has multiple categories, my analysis was centered around analyzing trends in the theater category, specifically plays.
After filtering and conditional formatting the data, I created a visual summary of the data via a pivot chart that identified the best time of year to launch a specific campaign. The requested data needed is specific to theater, so the chart is filtered by the parent category and years. The months are listed in a row with outcomes (successful, canceled, and failed) going across the top of the chart. To further illustrate the results, a line chart was created to add visualization to the data shown in the pivot chart.

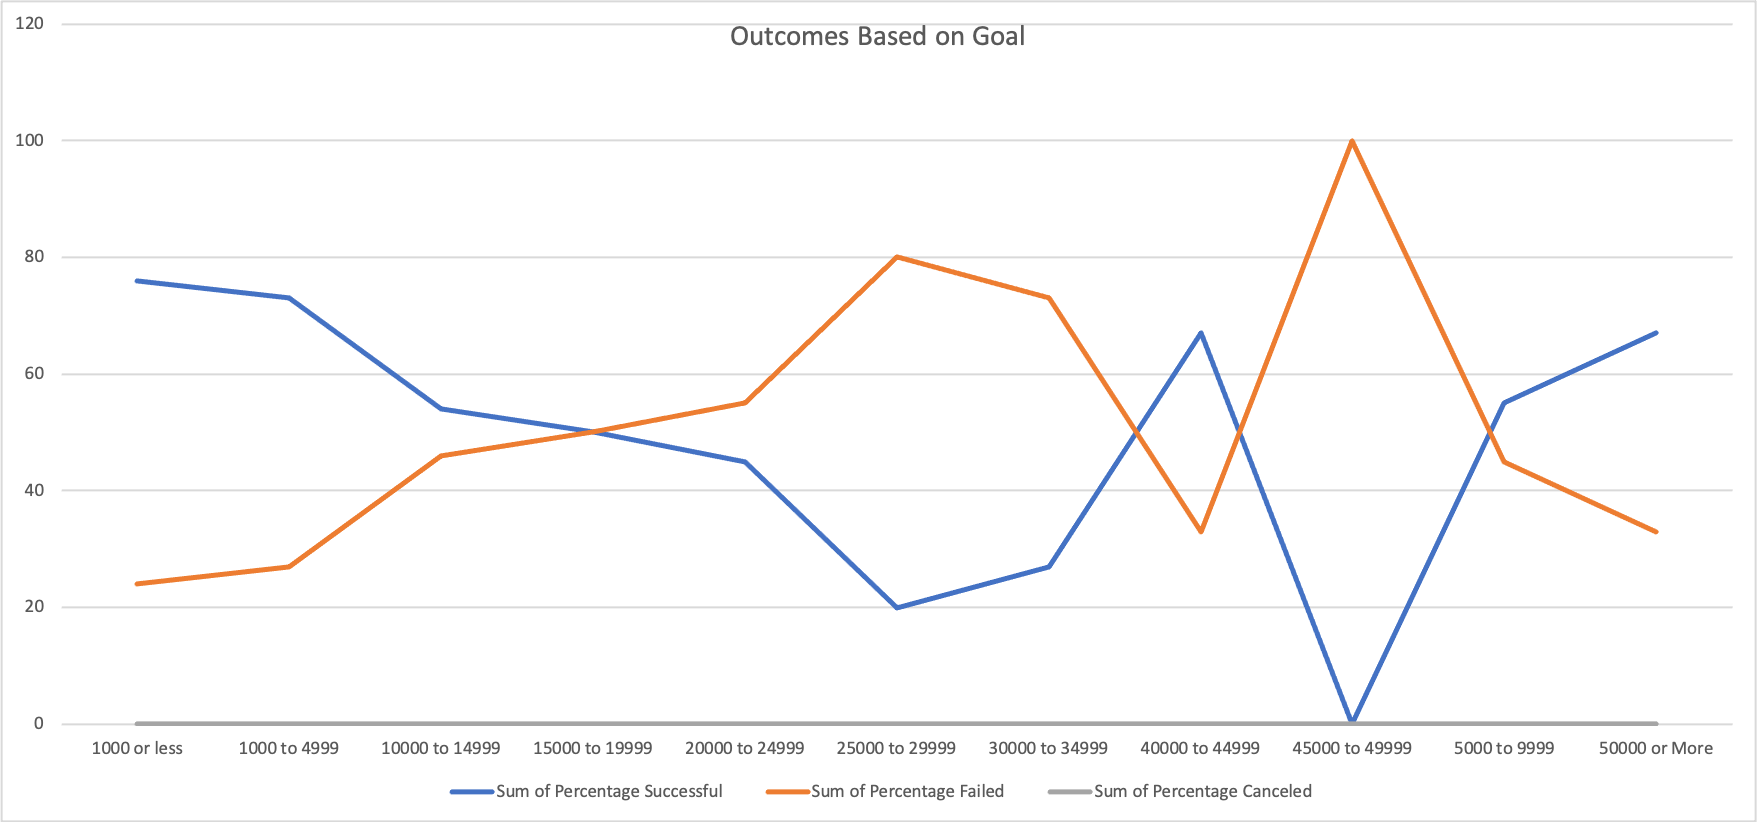
A new sheet was created in Excel with a table outlining the outcomes based on the campaign funding goals. The table consisted of 12 rows ranging from less than $1000, up to greater than $50,000, each row increasing by $5,000 increments. The use of the "COUNTIFS()" function was utilized to determine how many campaigns failed, canceled, or were successful. Once completed, the percentage of each result was calculated and charted. See below:
The biggest challenge in executing this analysis is determining how to display the results in a meaningful and productive format. When using a pivot table, there are multiple ways to display your data, and it became confusing with all the options allotted and different variations that were possible. With practice, I was to identify the best visual summary for the data given.
It was determined that May is the best time of the year to launch a theater campaign. May has the highest successful rate of 111 followed by June with 100. And July and October are both tied for the most failed campaigns at 50, so we would not advise starting any campaigns in those months. In the analysis of the outcome based on goals, I can conclude that the lower the goal, the higher the chances are for a successful campaign. For the goals set from $0 up to $20,000 all had a successful rate of 50 % or higher. Anything over $20,000 had a drastic decline in successful campaigns. The overall analysis dictates that it's best to begin your starter campaign in May and keep your goal under $20,000.