Created by Mark Clemmer and Matthew Fisk
This project takes in an input file with all the classes for a major and puts them into a graph, which is used to create a flowchart to show the order in which the classes could be taken.
This project was created in C++ with mingw and uses the Lemon library to make a graph out of the courses from an input file. This graph is then used to create both a text output and a visual flowchart using a Portable Pixel Map (PPM), which shows the courses that can be taken each quarter for the specific major.
- CMake VERSION 3.16.3 was used to create this project
- The GNU C++ Compiler is required to run the code through Ubuntu Linux
- The Lemon library included above is needed for the graph
- A ppm file viewer is needed to view the flowchart output. A ppm viewer can be downloaded or the online ppm viewer from this website can be used https://www.cs.rhodes.edu/welshc/COMP141_F16/ppmReader.html
Download the project from this repository. The Lemon library is included in this project, and no additional things are needed. Please watch this Youtube video (https://www.youtube.com/watch?v=ddMZyd1Rh9o) where we walked through running the code and showed what the output looks like.
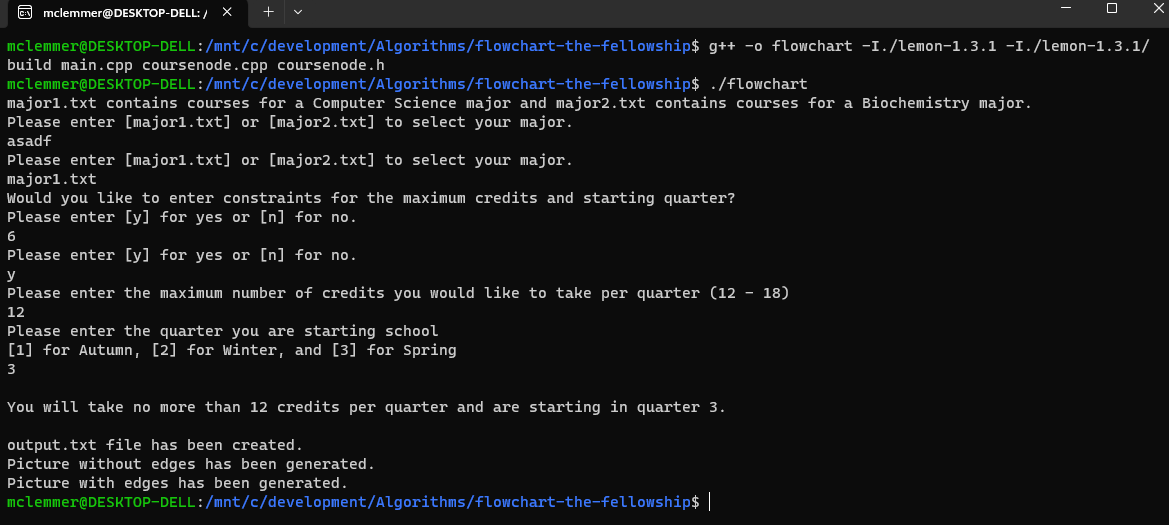
- g++ -o flowchart -I./lemon-1.3.1 -I./lemon-1.3.1/build main.cpp coursenode.cpp coursenode.h
- ./flowchart
- Follow the given instructions and input major1.txt or major2.txt.
- Type "y" to enter constraints or "n" to have no constraints. If "y" was selected, enter the maximum credits per quarter and the quarter when you would like to start school.
Running the project should look like this:
-
Navigate into the folder where this project is located
-
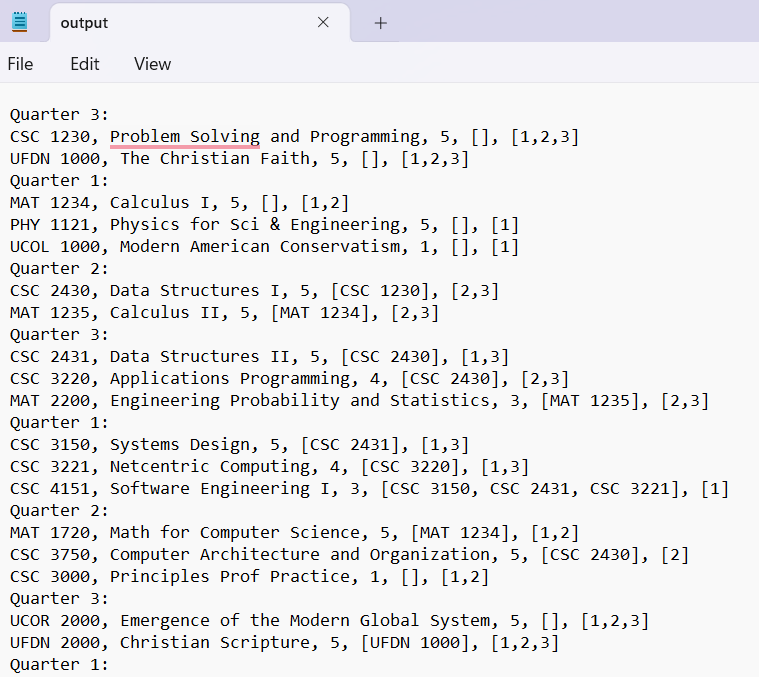
Open the output.txt file to see the text representation of how to take the courses. If you typed “y” into the command line when the code was running, output.txt will show the text representation with constraints. If “n” was entered, output.txt will show the text representation without constraints and automatically choose that the maximum credits per quarter should be 18, like in real life.
-
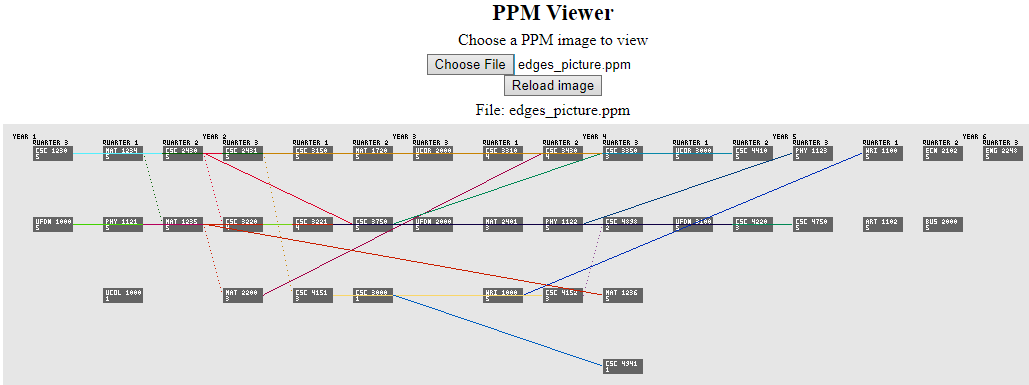
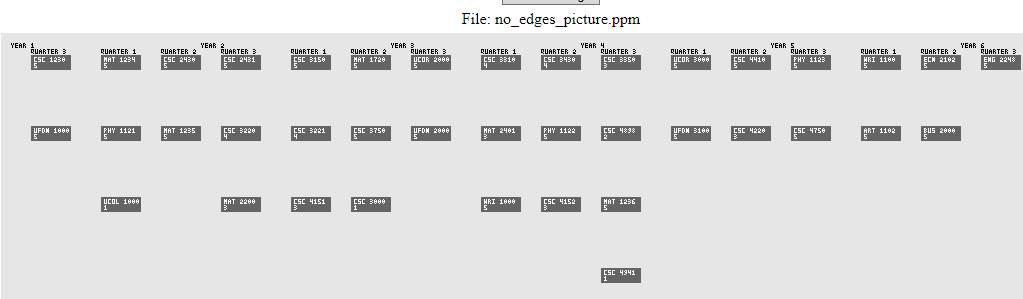
Just like with the output.txt file, the results for the flowchart files that are created will change depending on if there are constraints. Each time the project is run, it will create a flowchart with edges (edges_picture.ppm) and a flowchart without edges (no_edges_picture.ppm) since the edges can cross over the courses and make it hard to read.
-
Please open this ppm viewer (https://www.cs.rhodes.edu/welshc/COMP141_F16/ppmReader.html) and then select the no_edges_picture.ppm or edges_picture.ppm file to view it.
The list of courses are supplied in the .txt files and are formatted like:
CSC 1230, Problem Solving and Programming, 5, [], [1,2,3]
We have a filereader that iterates through every line in the selected .txt and saves it in memory in a CourseNode object that contains each datapoint from the line (Course code, course title, credits, prerequisites, and offering times). The coursenode object is saved in a Node object from lemon, that is part of our graph. The Node objects are ordered as the .txt was ordered. The filereader runs in O(n) time.
Each node is iterated through, and for all of its prerequisites every other node in the graph is checked. When it finds the node that matches, an edge is drawn from that node and towards the original node. This code runs in O(mn^2) time, where m is the number of prerequisites and n is the number of nodes.
The code then iterates through every node and defines nodes with no prerequisites as “rootCourses”, these are the classes an incoming freshman can take. These rootCourses are placed into an array of sets, where the array indexes are ordered by quarter, and the set that is contained is the set of all available classes that the current student can take that quarter. For example, availableClasses[0] contains the set of all classes the student can feasibly take during fall. These sets are initialized for an incoming freshman and only contain classes with no pre-requirsites to start off. The rootCourses iterator runs in O(n) time.
In order to decide which classes are taken which quarter, a value called priority is assigned inside each CourseNode object. The priority variable defines how valuable the class is, and our code will take a class with the highest priority over anything else first (it is a greedy algorithm).
Priority is best defined as the length of the longest path from any given node. The idea is you want to get the classes that are the super prerequisites out of the way as soon as possible. In order to assign the priority of each node, it is important to realize that the directed graph cannot move backwards at all. A class cannot be a prerequisite for its own prerequisite. This means that the whole graph is a directed acyclic graph and can be traversed like a tree. We run a recursive DFS on each rootCourse and increment each priority of each node as we traverse back up the tree. The code is written dynamically, if a node's priority was already set by a previous call of DFS, a future DFS recognizes that and does not traverse down that path. This code is run in O(n) time.
We then start at the starting quarter, and iterate through the set in availableClasses[] for that quarter. The code finds the class in the set with the best priority, and takes that class if there are remaining credits for it. If so, it removes the class from all sets in availableClasses[], decrements the credits left that can be taken that quarter, and repeats until there are no more classes to take. This code runs in O(n + (n-1) + (n-2)...) where n is the set size (normally around 10 at most) and not the number of total nodes. After this is done, the quarter is incremented, all courses connected to the edges of taken classes are added to availableClasses[], and the code repeats again. This code repeats until all courses are taken.
We tried a lot of different things when it came to the graphics output. Some of the things we tried were:
- Setting up OpenGL with glfw
- This was too overkill and too complicated for us to learn from scratch.
- Creating a front-end with browser javascript
- We tried building the graphics via an output file from c++, but web browsers block direct file viewing. We would need a live server to get it to work, and that wouldn't work easily without using VSCode's Liveserver. Which we couldn't use since IDEs were off-limits here.
- We looked into WebAssembly to connect our c++ code to javascript but we didn't have any luck.
- Creating a python front-end and using tkinter to create a GUI
- Was pretty promising, but the output would never run from Ubuntu no matter what we tried. The displays wouldn't be assigned and a window would never pop-up, the tkinter module wouldn't download, the tkinter module wouldn't be recognized, the displays were getting locked in linux.
- Creating a python front-end and using diagrams in graphvis.
- Had a challenging time connecting the output from the c++ code to the python code in a meaningful way.
Ultimately we ended up outputting a .ppm file, which is a "Portable Pixel Map," and is a list of the rgb values in an image. We used this like a bitmap and iterated over the pixels we wanted to recolor. It was a lot of work considering everything had to be written from scratch, but it was extremely straight-forwards. We wrote our own box generation, word generation function, and line renderer.
The box generator takes the x and y coordinates, width, height, and color. It simply starts at x and y and recolors going horizontally to the right and vertically downwards.
The word generation takes a string, an x/y coordinate, and color. and for each character in that string it calls a letter generation for every character. The letter generation stores integer arrays defining the outlines of the letters in a switch case. These letters are mapped onto the image at the correct location with their respective color.
The line renderer takes in a start position, end position, and color. It calculates the slope as a float and iterates through the x positions, placed it at the correct y coordinate according to the slope.