This repository contains a portfolio of Data Visualization projects that were completed by me for academic and self learning purposes. The projects are presented in the form of Tableau workbooks.
The dashboards can be viewed in my Tableau Public account which can be found here.
The datasets used in these workbooks are for demostration purposes.
- Download Tableau Public to be able to access and view the following workbooks.
- Tableau Workbook
- Datasets
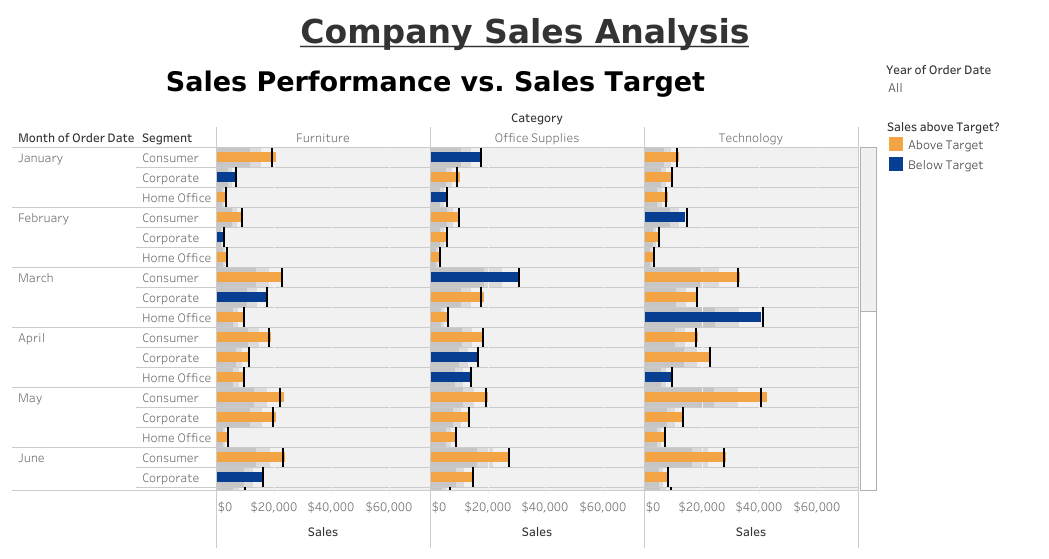
- Company Sales Analysis (Part 1):
- Different product segments and categories are displayed on the dashboard. The dashboard helps identify segments and categories that have met, fallen short of or exceeded their respective sales target.
- Company Sales Analysis (Part 2):
- Certain customer statistics, such as the region they are from and a breakdown of each customer's sales and profit performance are displayed on the dashboard.

- Customer Analysis:
- Customers of a company are separated into their respective age groups and regions. Further analysis is performed to reveal the amount of revenue and profit each age group produces and the total amount of revenue each region produces.

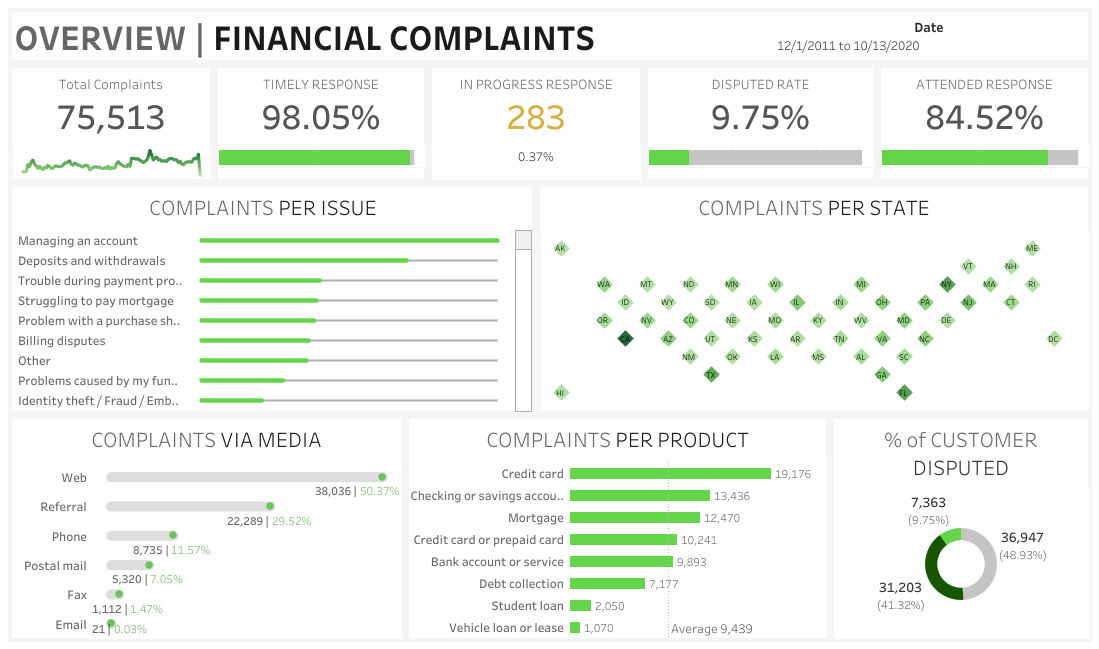
- Financial Consumer Complaints:
- Complaints made by customers of a company are analysed and displayed on a dashboard. The total amount of complaints, the dispute rate and other factors are analysed here.
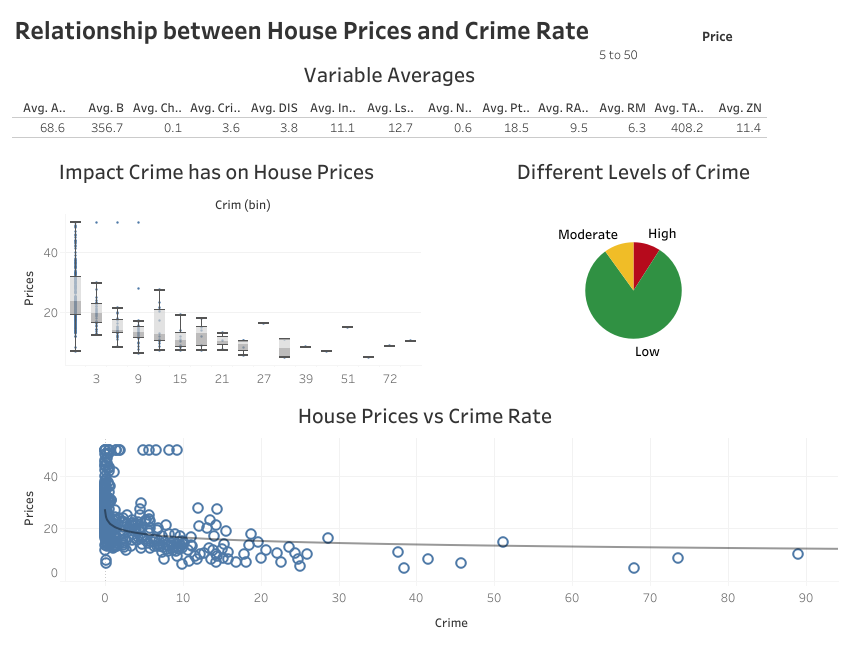
- House Prices in Boston:
- The relationship between house prices and the crime rate in a particular region is analysed and used to predict the prices of houses in the city of Boston.
- Revenue and Product Analysis:
- An analysis of company sales of each product and the total amount of revenue obtained from the sales across four regions is analysed and displayed onto a dashboard.
