Colors & Colorbars
On this page are examples of how QOL.plots can help you deal with colors & colorbars:
- Create a nice colorbar (default)
- Create a well-labeled colorbar for discrete data
- Create a discrete colormap
- Determine the Nth color (e.g. in default plot color cycle)
- Show all available colormap options
Before running any of the following examples, make sure to do:
import matplotlib.pyplot as plt
import numpy as np
import QOL.plots as pqolIn its most basic form, this is accomplished by:
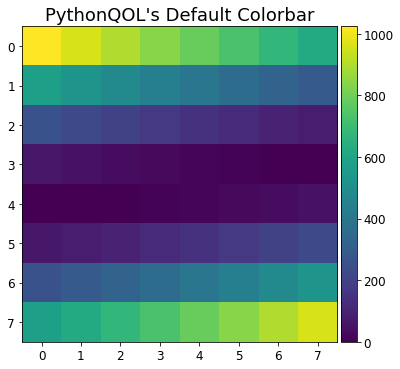
pqol.colorbar()For comparison, below are images showing matplotlib's default colorbar and PlotQOL's default colorbar.
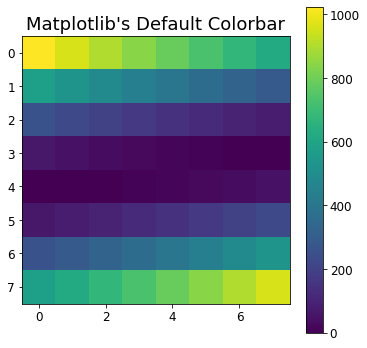
plt.imshow((np.arange(64).reshape(8,8) - 32)**2)
plt.title("Matplotlib's Default Colorbar")
plt.colorbar()
plt.show()

plt.imshow((np.arange(64).reshape(8,8) - 32)**2)
plt.title("PythonQOL's Default Colorbar")
pqol.colorbar() #Note it is pqol.colorbar(), not plt.colorbar().
plt.show()In its most basic form, this is accomplished by:
data = ... #your data goes here
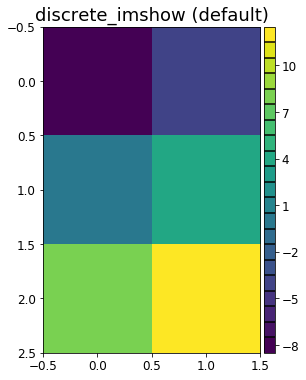
pqol.discrete_imshow(data, colorbar=True)Below are some examples of using pqol.discrete_imshow, and matplotlib's imshow for comparison.
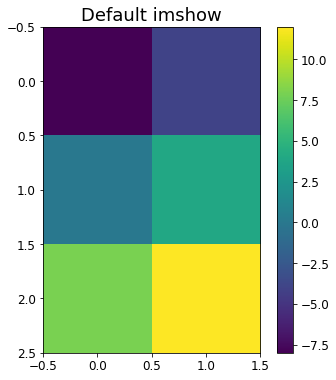
image_data = np.array([[-8,-4],[0,4],[8,12]])
## Default matplotlib imshow ##
plt.imshow(image_data)
plt.title("Default imshow")
plt.colorbar()
plt.show()
## Default PlotQOL discrete_imshow ##
pqol.discrete_imshow(image_data, do_colorbar=True)
plt.title("discrete_imshow (default)")
plt.show()
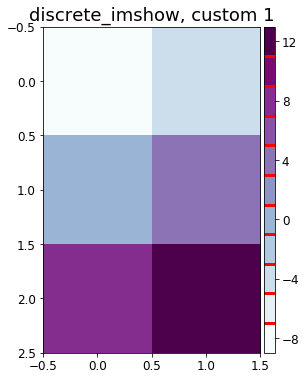
## PlotQOL discrete_imshow, custom 1 ##
colormap = 'BuPu' #colormap. first 2 plots were 'viridis' by default.
cgrid=dict(color='gold', #gridlines of colorbar - color.
linewidth=3 ) #gridlines of colorbar - linewidth.
stepsize = 2 #discrete step size. == 1 by default.
pqol.discrete_imshow(image_data, base_cmap=colormap, step=stepsize,
do_colorbar=True, cgrid_params=cgrid)
plt.title("discrete_imshow, custom 1")
plt.show()
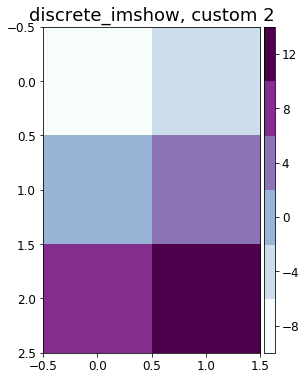
## PlotQOL discrete_imshow, custom 2 ##
colormap = 'BuPu' #colormap. first 2 plots were 'viridis' by default.
cgrid=dict(grid=False) #gridlines of colorbar - removed.
stepsize = 4 #discrete step size. == 1 by default.
pqol.discrete_imshow(image_data, base_cmap=colormap, step=stepsize,
do_colorbar=True, cgrid_params=cgrid)
plt.title("discrete_imshow, custom 2")
plt.show()For further customization consider combining the pqol.colorbar(discrete=True) and pqol.discrete_cmap() functions.
At the heart of the discrete_imshow and Nth_color examples above is the discrete_cmap function. Most users will not need to use this function direction, but rather may prefer to call the functions from the previous examples.
In its most basic form, this is accomplished by:
pqol.discrete_cmap(N, cmap) #N=number of colors, cmap = colormap object, string, or NoneThis will create a discrete colormap with N colors, interpolated based on the colormap represented by cmap. If cmap is None, uses the default colormap (plt.cm.get_cmap(None), likely 'viridis'). If cmap is a string, uses matplotlib's colormap represented by that string (see matplotlib colormaps, or call pqol.colormaps() to print all the default colormaps available).
##TODO: update page with these examples
- Show all available colormap options
- Determine the Nth color (e.g. in default plot color cycle)