Colors & Colorbars
On this page are examples of how QOL.plots can help you deal with colors & colorbars:
- Create a nice colorbar (default)
- Create a well-labeled colorbar for discrete data
- Show all available colormap options
- Create a discrete colormap
- Determine the Nth color (e.g. in default plot color cycle)
Before running any of the following examples, make sure to do:
import matplotlib.pyplot as plt
import QOL.plots as pqolIn its most basic form, this is accomplished by:
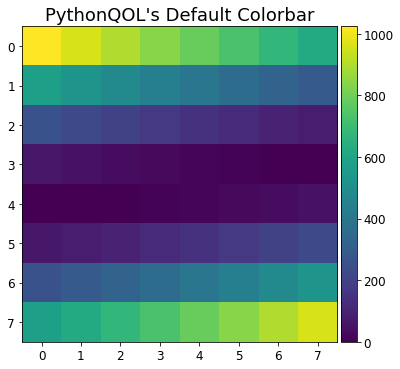
pqol.colorbar()For comparison, below are images showing matplotlib's default colorbar and PlotQOL's default colorbar.
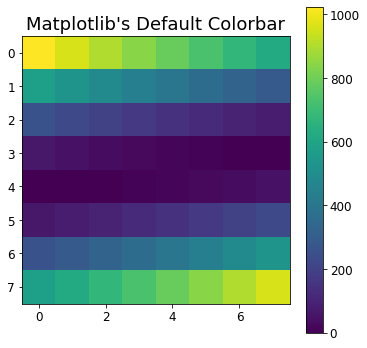
plt.imshow((np.arange(64).reshape(8,8) - 32)**2)
plt.title("Matplotlib's Default Colorbar")
plt.colorbar()
plt.show()

plt.imshow((np.arange(64).reshape(8,8) - 32)**2)
plt.title("PythonQOL's Default Colorbar")
pqol.colorbar() #Note it is pqol.colorbar(), not plt.colorbar().
plt.show()In its most basic form, this is accomplished by:
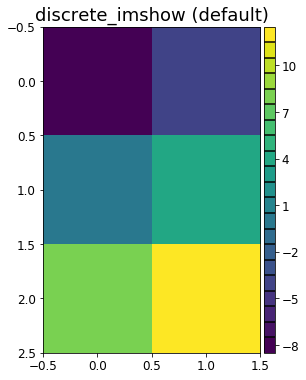
data = ... #your data goes here
pqol.discrete_imshow(data, colorbar=True)
Below are some examples of using pqol.discrete_imshow, and matplotlib's imshow for comparison.
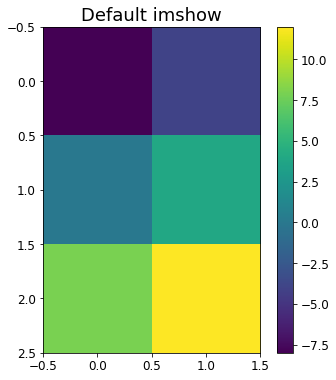
image_data = np.array([[-8,-4],[0,4],[8,12]])
## Default matplotlib imshow ##
plt.imshow(image_data)
plt.title("Default imshow")
plt.colorbar()
plt.show()
## Default PlotQOL discrete_imshow ##
pqol.discrete_imshow(image_data, do_colorbar=True)
plt.title("discrete_imshow (default)")
plt.show()
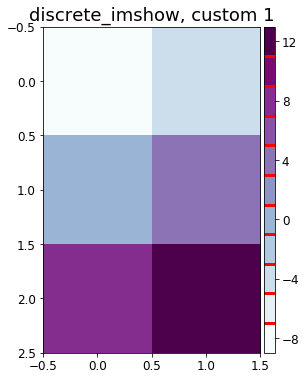
## PlotQOL discrete_imshow, custom 1 ##
colormap = 'BuPu' #colormap. first 2 plots were 'viridis' by default.
cgrid=dict(color='gold', #gridlines of colorbar - color.
linewidth=3 ) #gridlines of colorbar - linewidth.
stepsize = 2 #discrete step size. == 1 by default.
pqol.discrete_imshow(image_data, base_cmap=colormap, step=stepsize,
do_colorbar=True, cgrid_params=cgrid)
plt.title("discrete_imshow, custom 1")
plt.show()
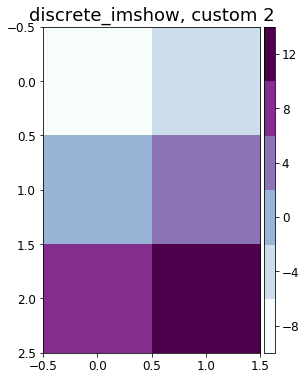
## PlotQOL discrete_imshow, custom 2 ##
colormap = 'BuPu' #colormap. first 2 plots were 'viridis' by default.
cgrid=dict(grid=False) #gridlines of colorbar - removed.
stepsize = 4 #discrete step size. == 1 by default.
pqol.discrete_imshow(image_data, base_cmap=colormap, step=stepsize,
do_colorbar=True, cgrid_params=cgrid)
plt.title("discrete_imshow, custom 2")
plt.show()For further customization consider combining the pqol.colorbar(discrete=True) and pqol.discrete_cmap() functions.
##TODO: update page with these examples
- Show all available colormap options
- Create a discrete colormap
- Determine the Nth color (e.g. in default plot color cycle)