Repository navigation
Figures
The book has 249 figures. None are decorative clip-art. Each is computed from the equations and data in the text: wavefunctions from Hermite polynomials, spectra from the derived line positions, and Hartree–Fock and full-CI results from a small Gaussian-integral code.
figures/
├── scripts/
│   ├── figstyle.py      # shared style: palette, fonts, sizes, save()
│   ├── ch01.py … ch23.py
│   ├── spec01.py … spec14.py
│   └── appA.py … appE.py
├── ch01/ … ch23/        # generated PNGs (200 dpi)
├── spec01/ … spec14/
└── appA/ … appE/
- There is one script per chapter, and it writes every figure in that chapter.
-
All scripts share
figstyle.py: a colour-blind-safe Okabe–Ito palette, Computer Modern math labels and a white background. This gives the whole book one visual system. - Only numpy, scipy and matplotlib are needed.
Regenerate everything, or only selected chapters:
python scripts/build-figures.py
python scripts/build-figures.py ch05 ch13Figures are numbered per chapter (Figure 5.2, A.1 …) and referred to in the prose. Each one is embedded with a relative link, which works on GitHub, in Obsidian and in the PDF:

*Figure 5.2 — caption …*
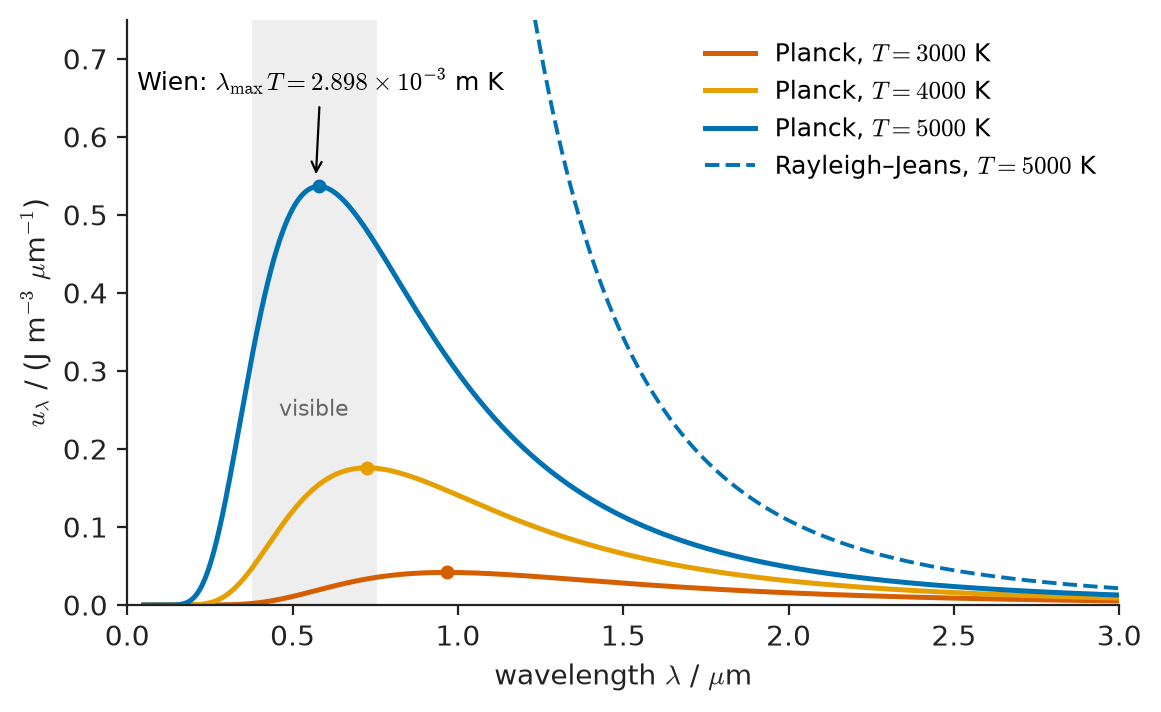 1 Planck vs Rayleigh–Jeans |
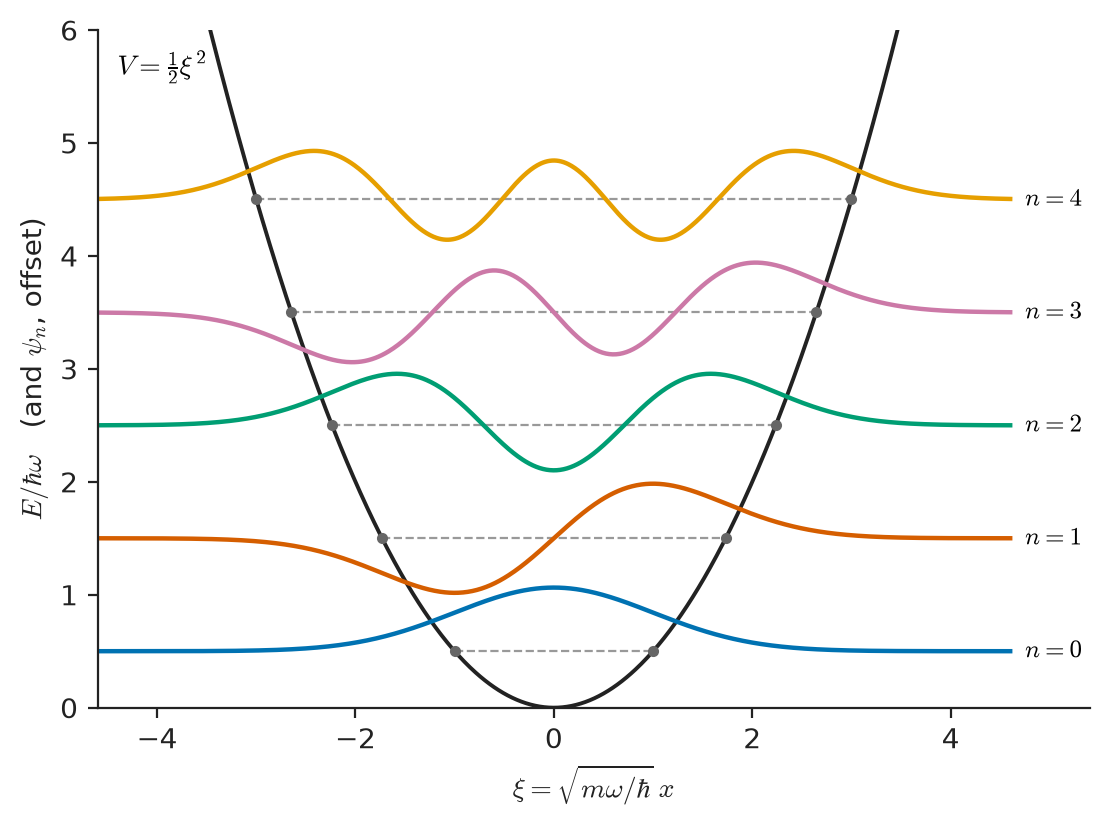 5 Harmonic-oscillator wavefunctions |
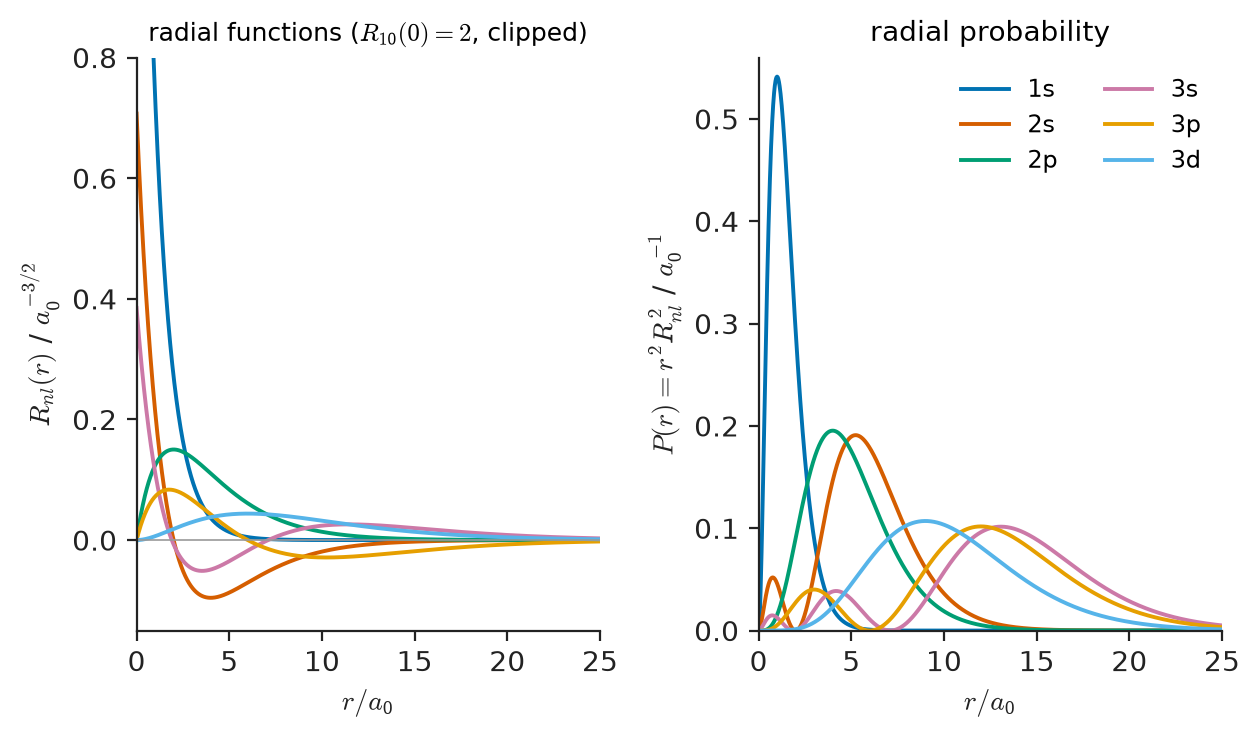 6 Hydrogen radial distributions |
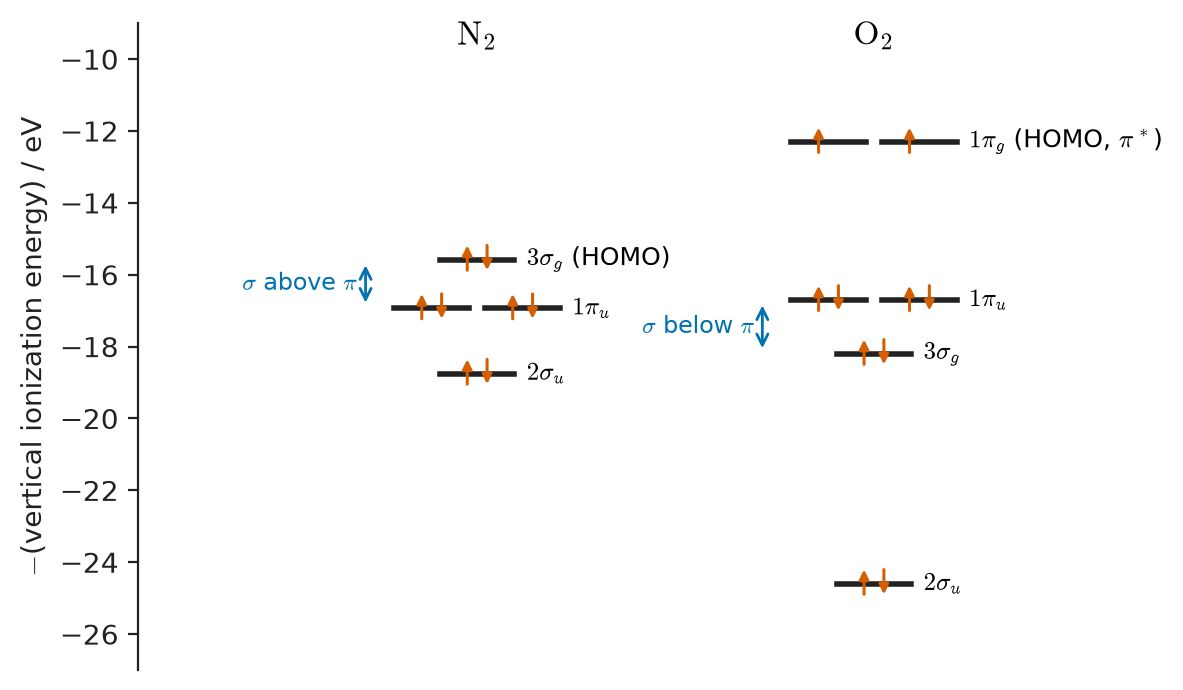 10 N₂ and O₂ orbital levels |
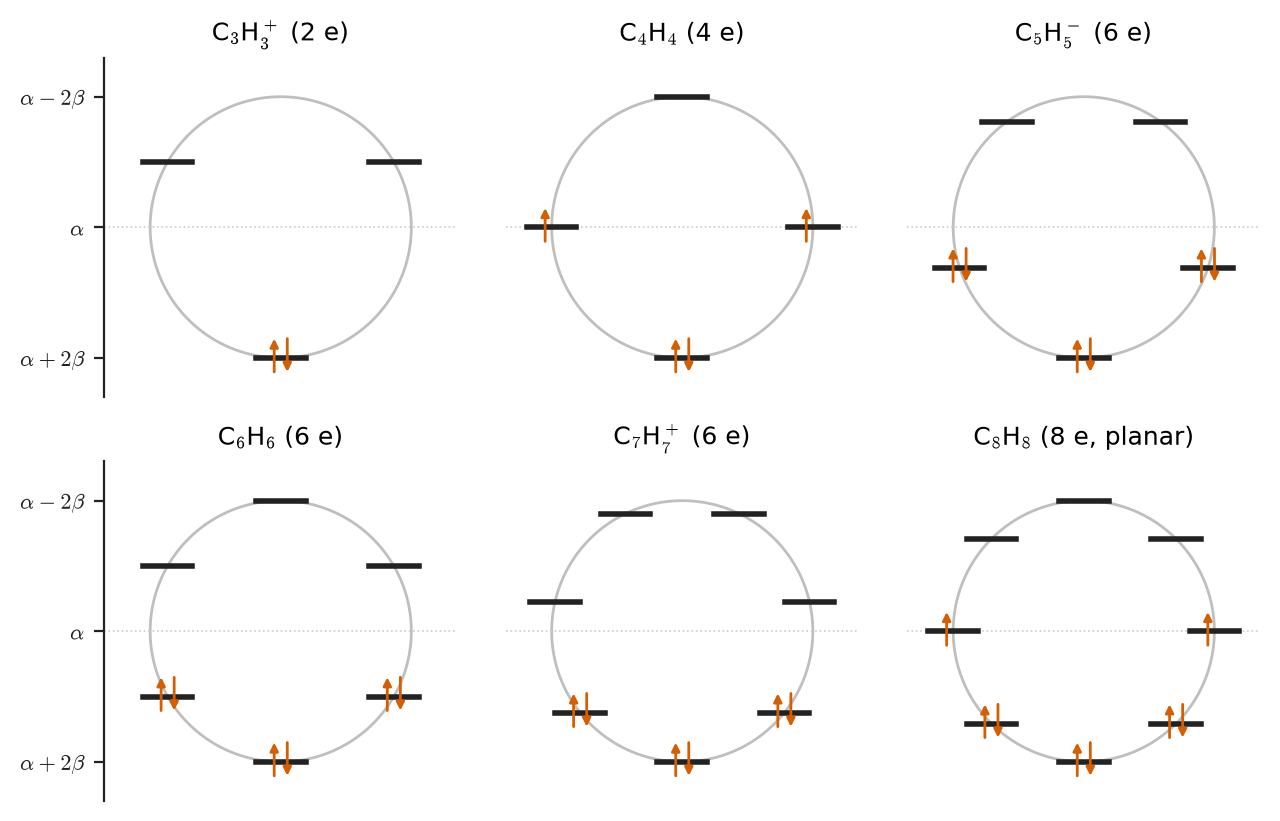 12 Frost circles |
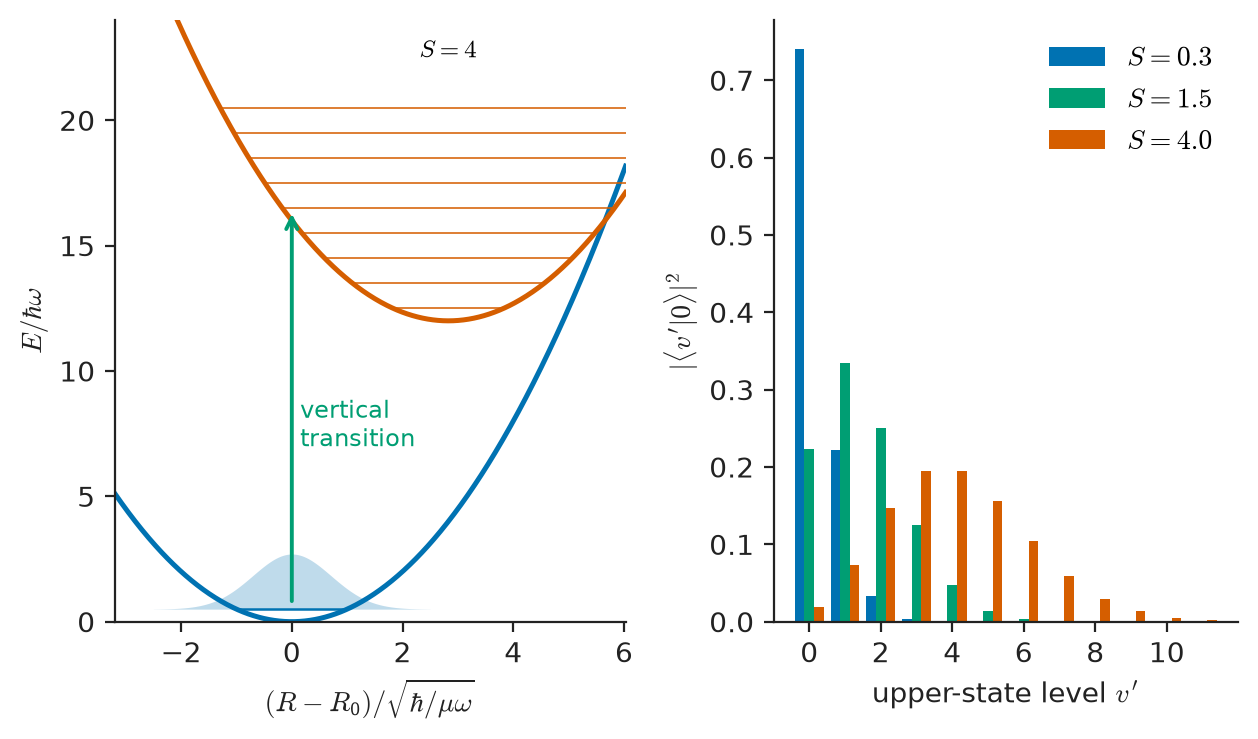 13 Franck–Condon principle |
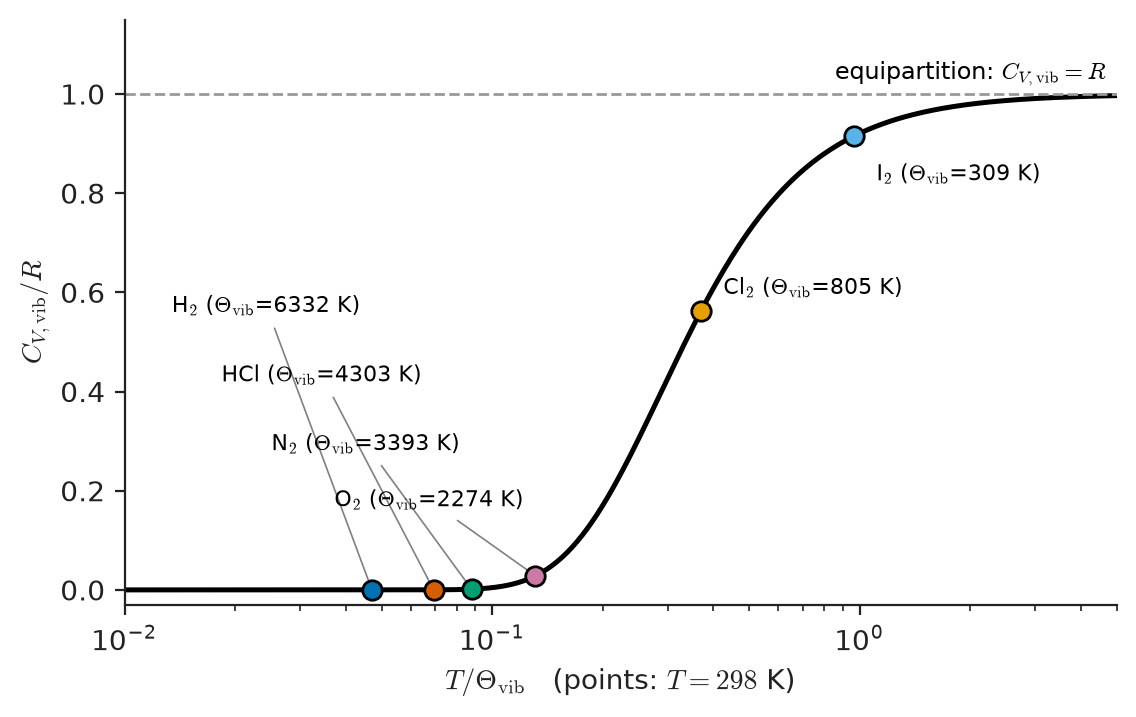 15 Vibrational heat capacity |
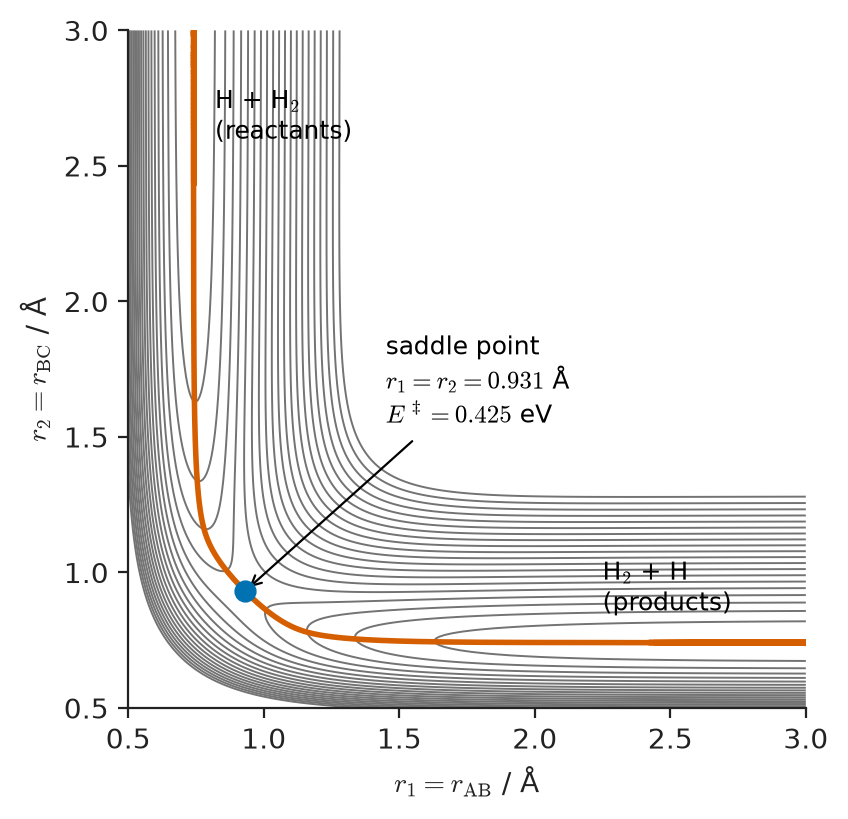 16 LEPS surface for H + H₂ |
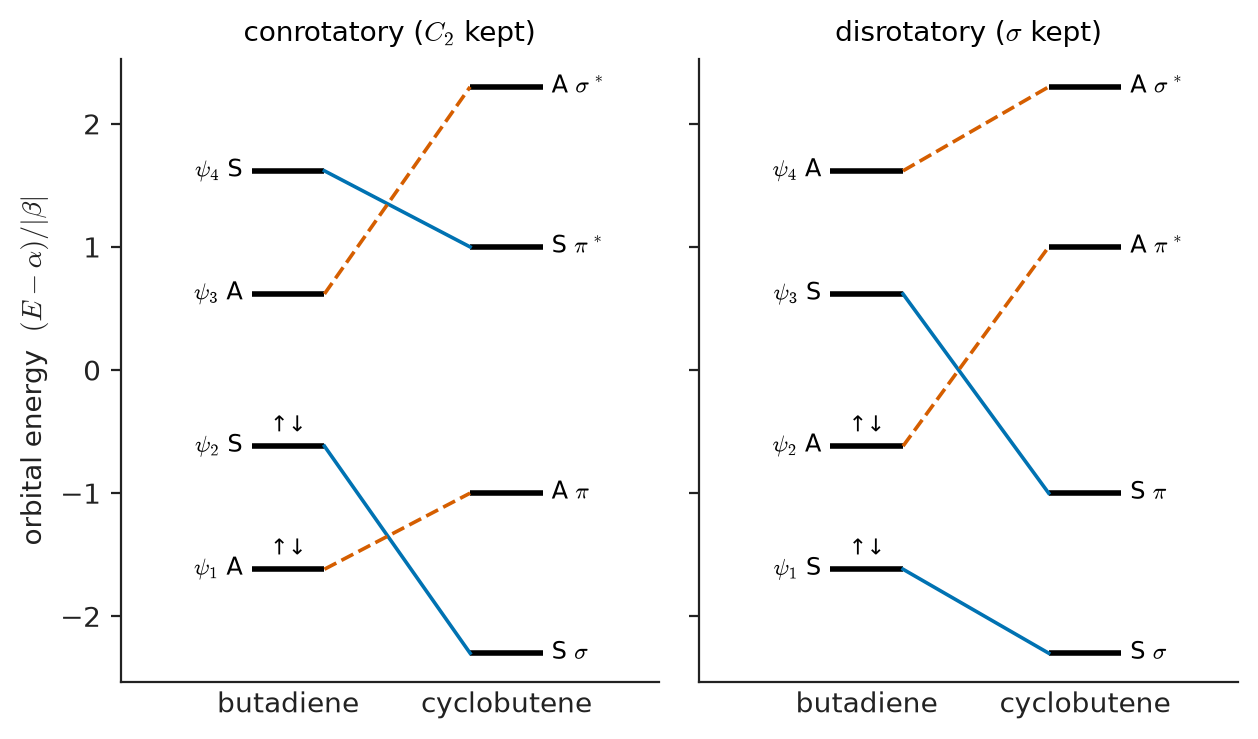 18 Butadiene orbital correlation |
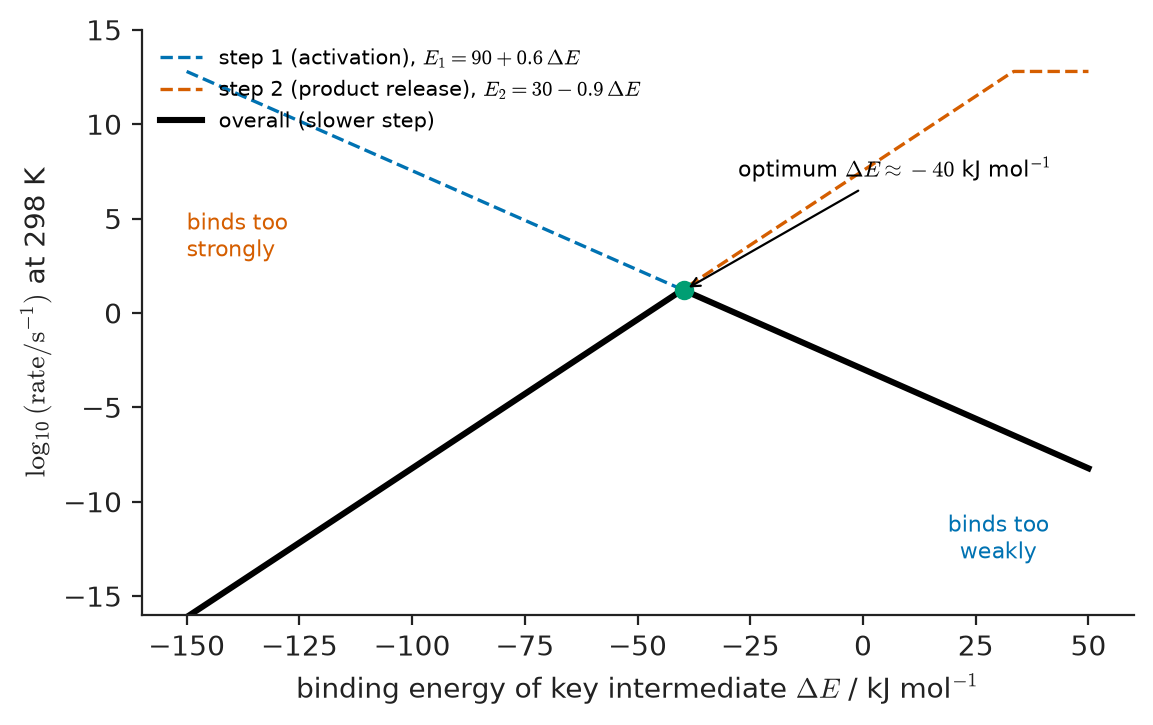 20 Sabatier volcano |
A few figures use chosen model parameters rather than fitted data, for example the Walsh diagram, the volcano plot and the Brønsted plot. Their captions say so.