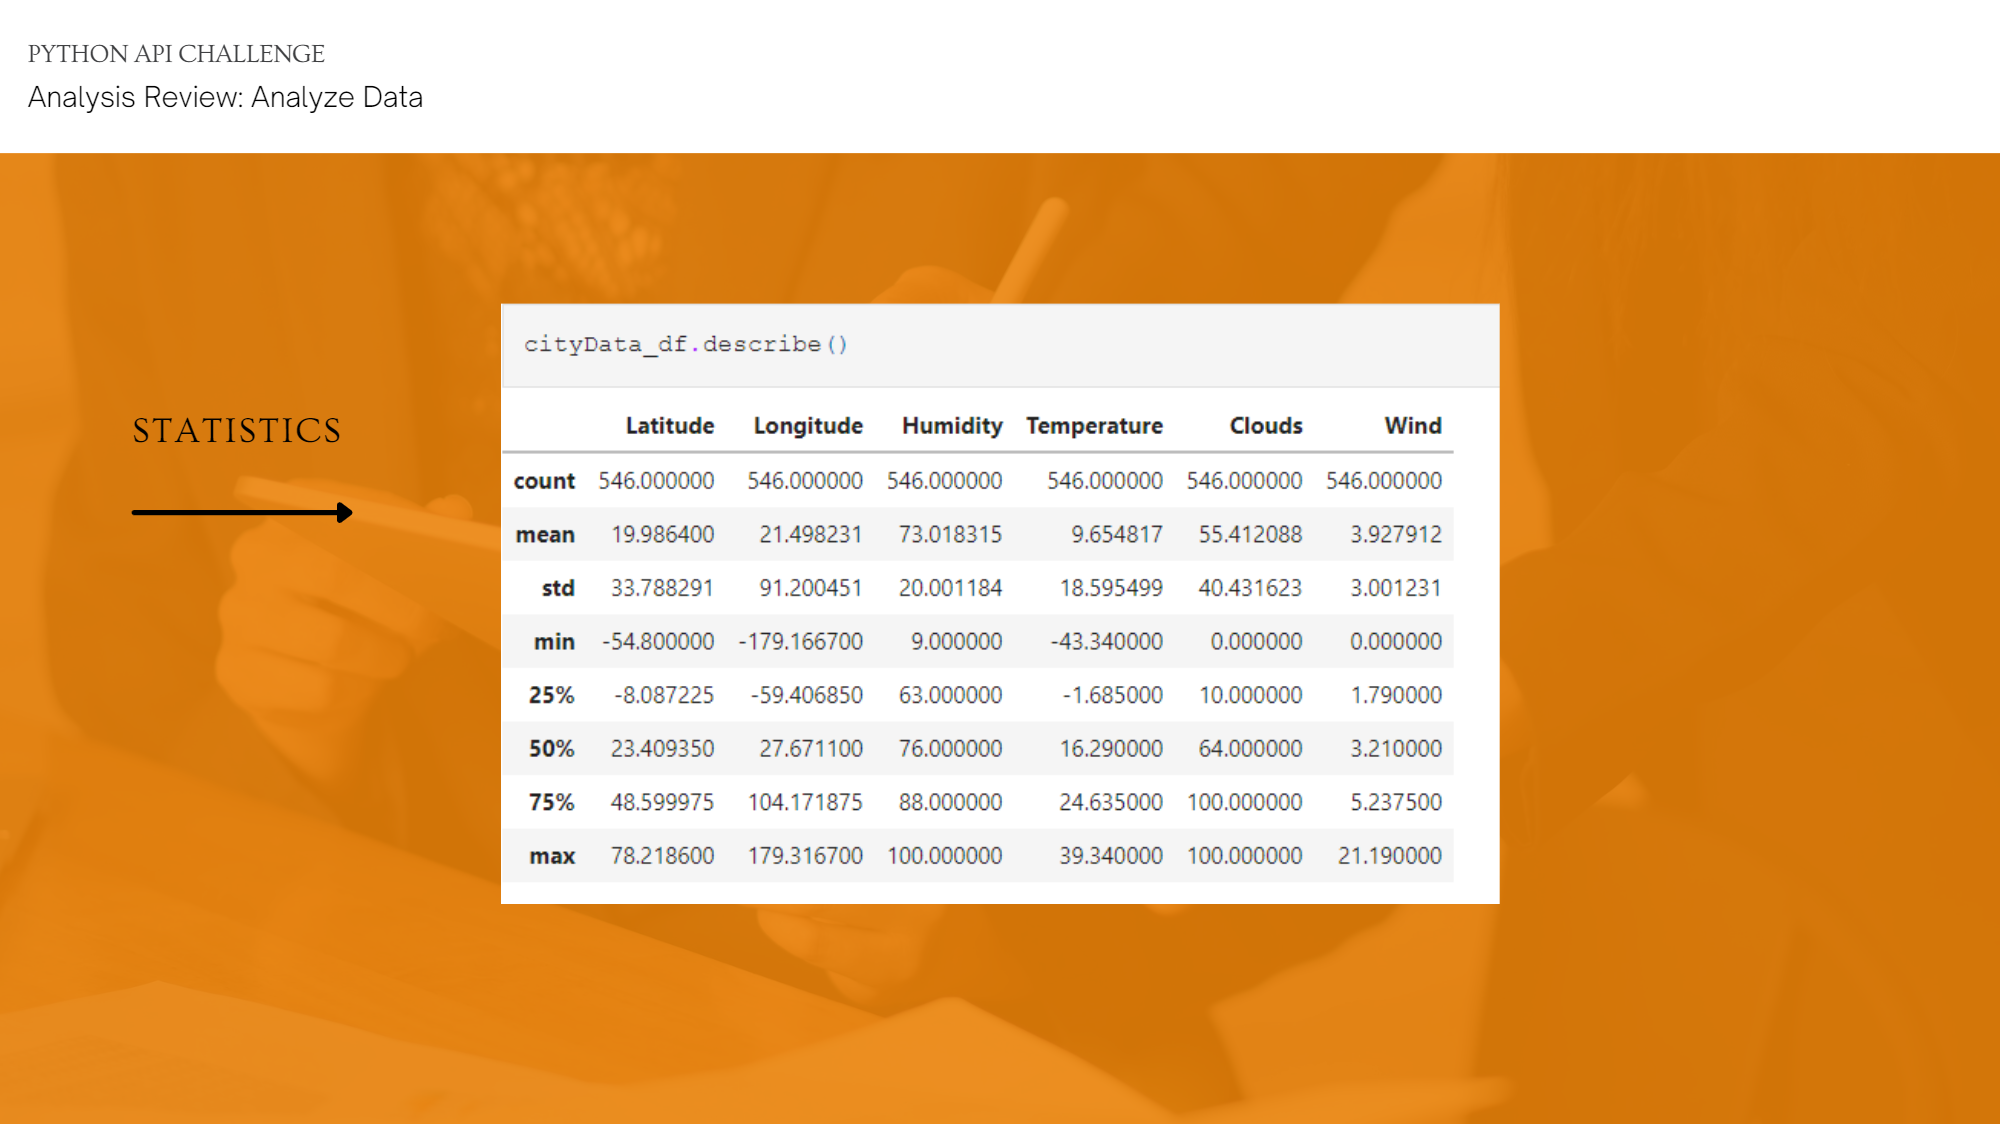
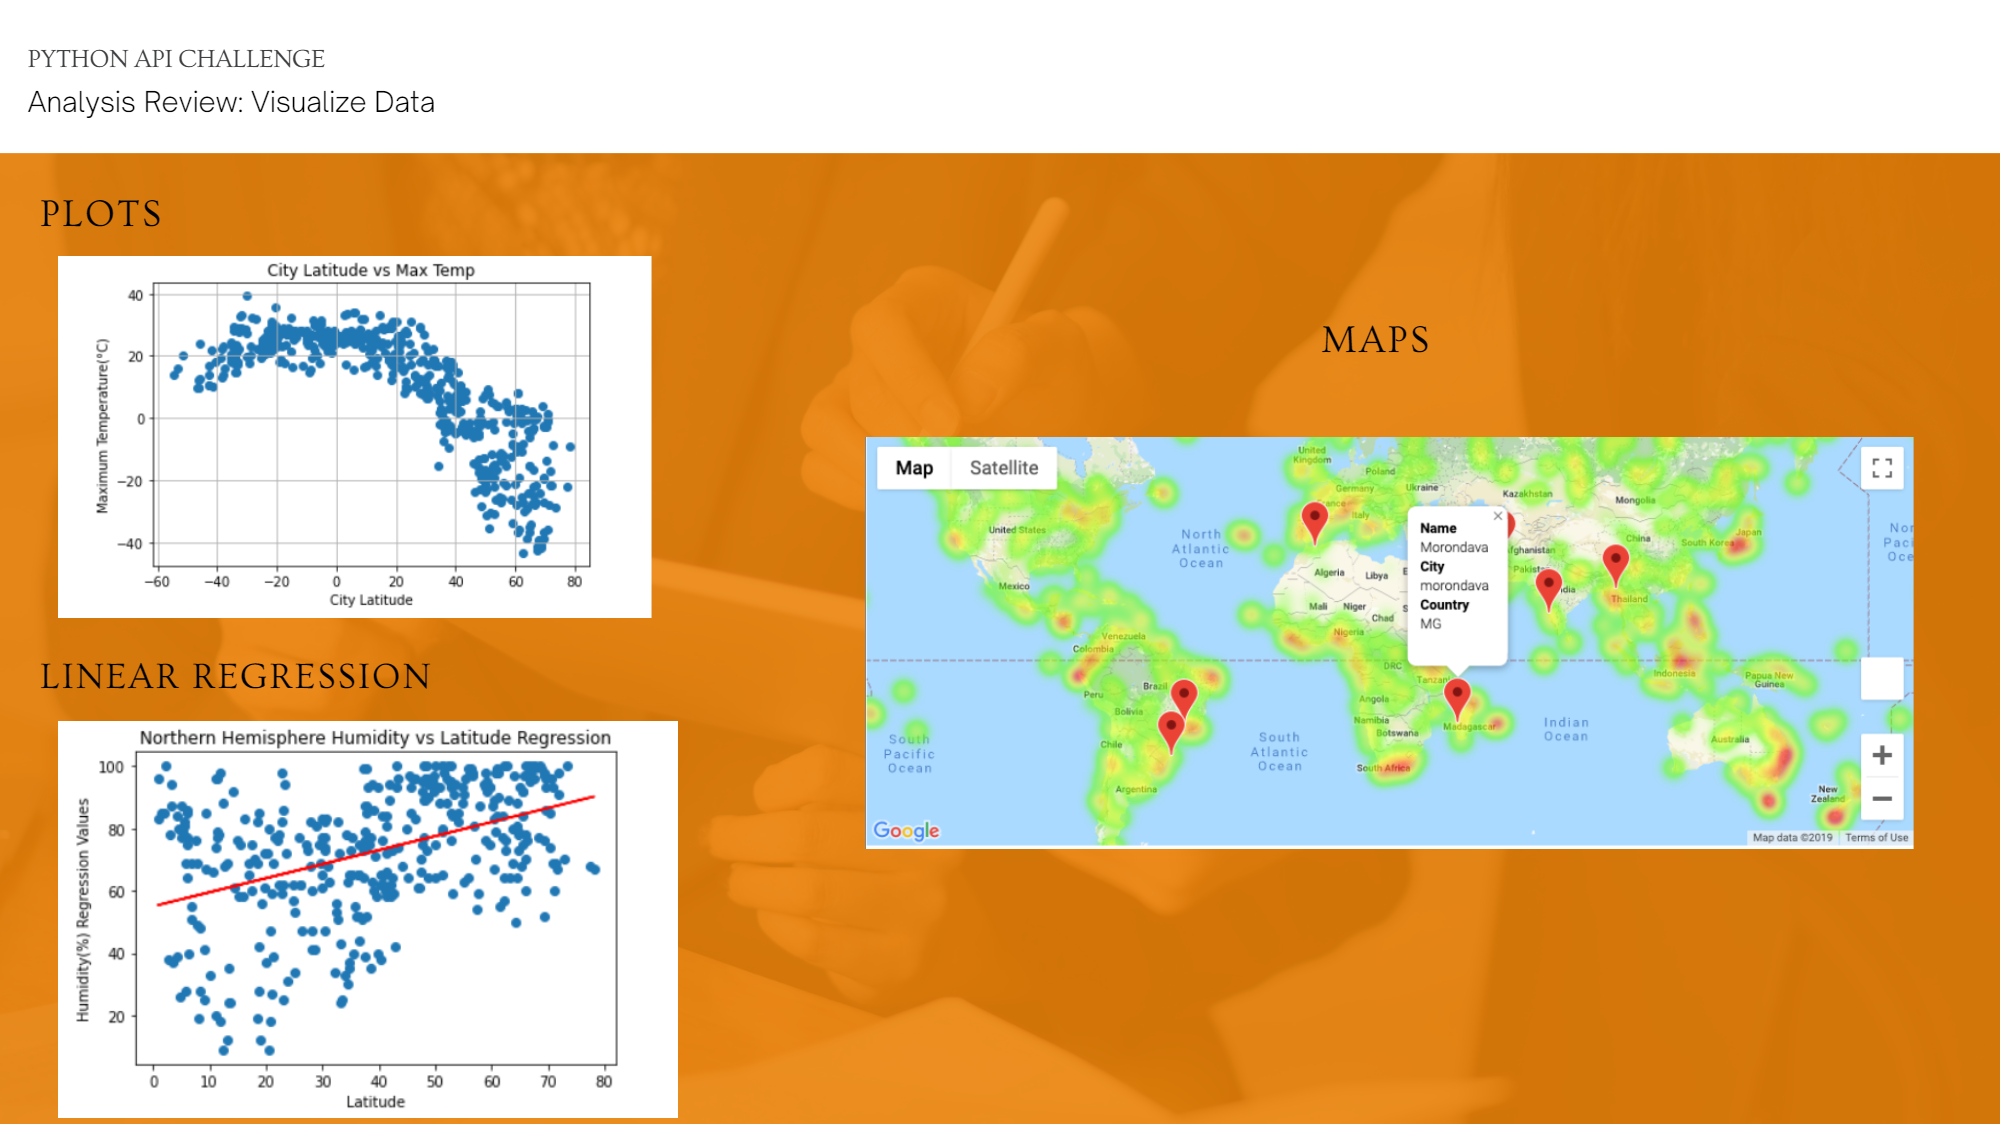
Using what I've learned about Python scripting and API requests to answer a fundamental question: "What's the weather like as we approach the equator?"
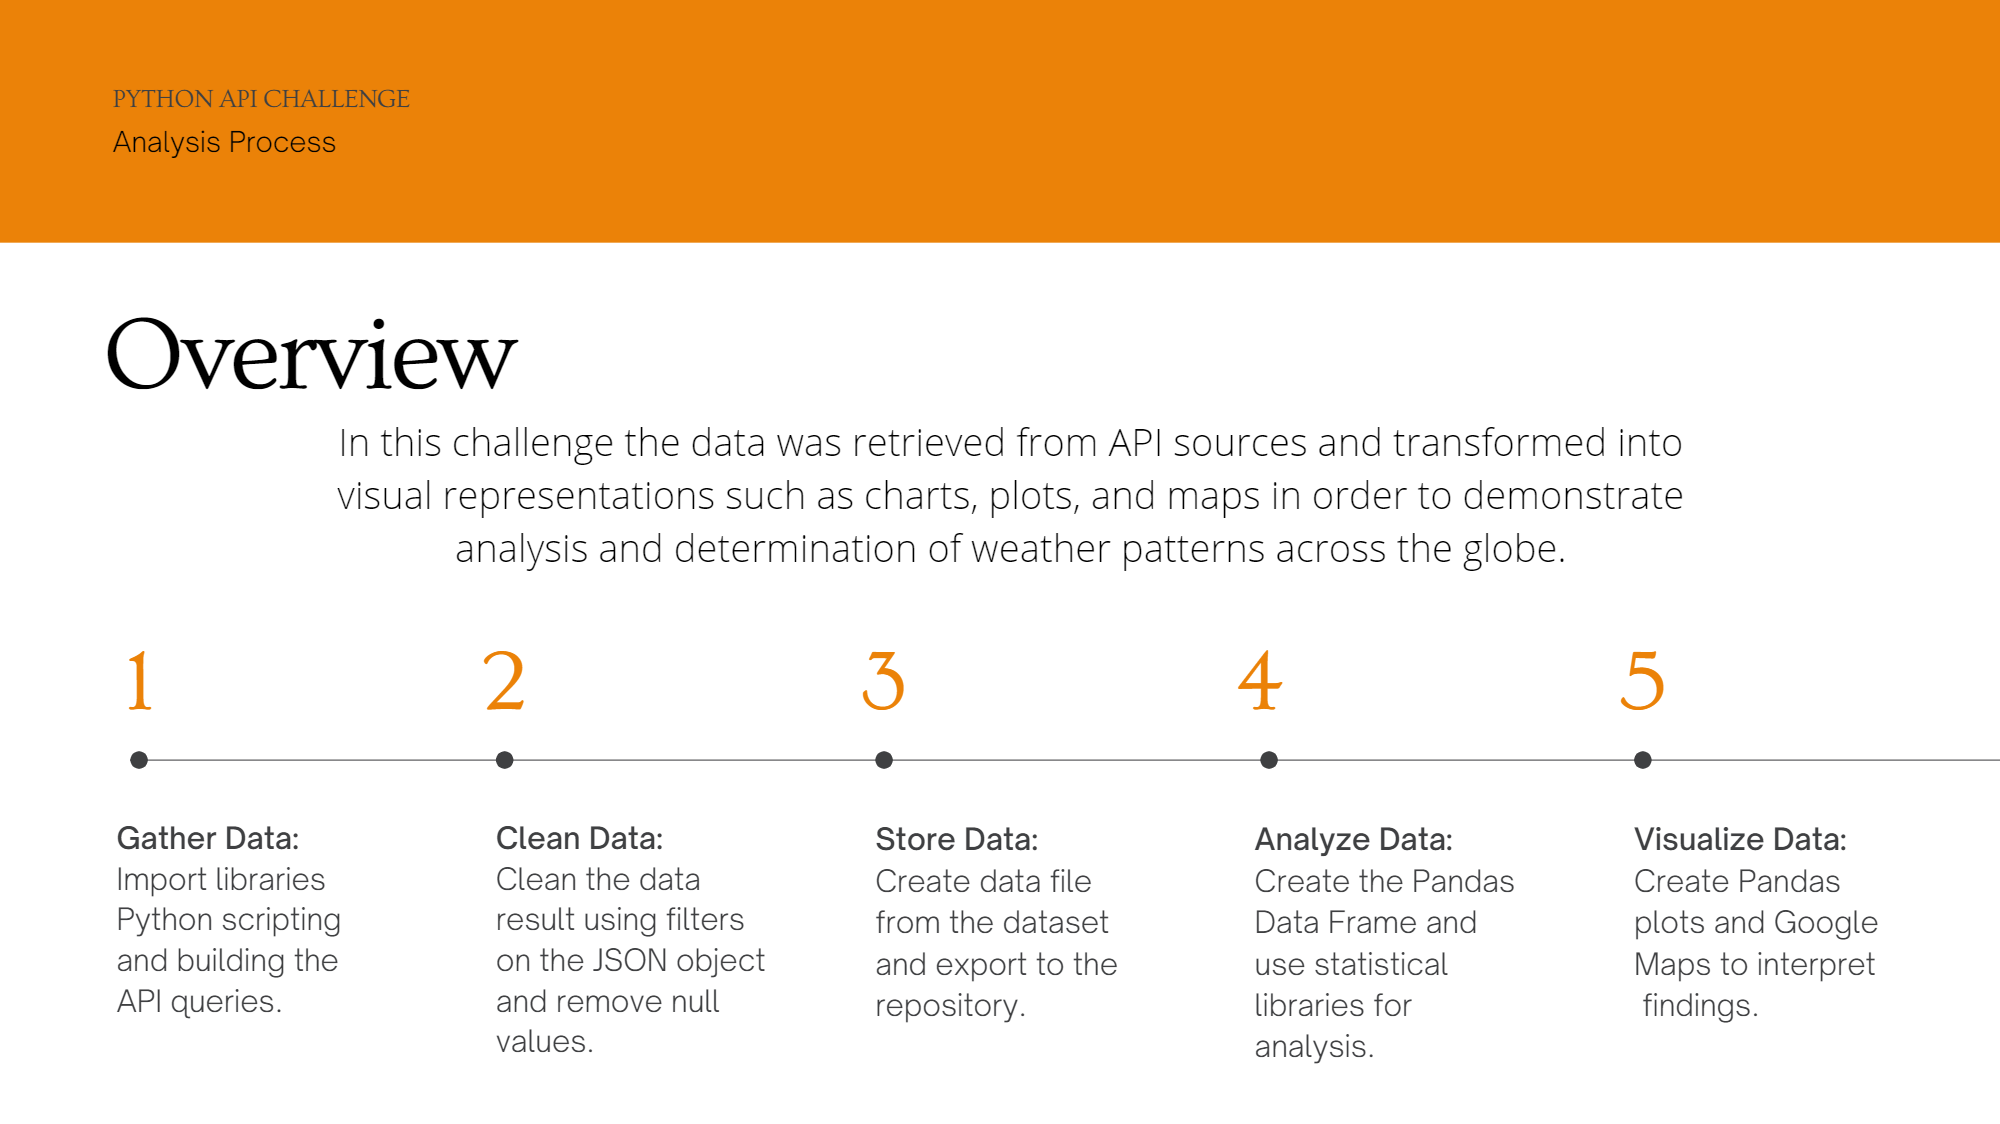
In this challenge the data was retrieved from API sources and transformed into visual representations such as charts, plots, and maps in order to demonstrate analysis and determination of weather patterns across the globe.