Created for the purpose of a job interview (During 24 hours)
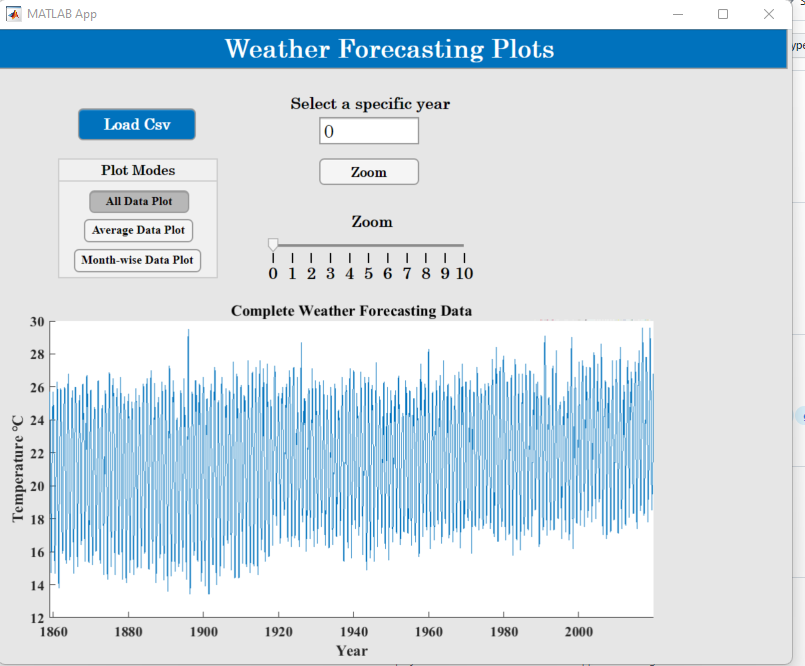
Use the load button and loat a csv file with a format like one extracted from here http://www.bom.gov.au/climate/data. (see the recognized rows of csv by opening the app). After launching, you will have 3 seperate choices, you can plot and have insights of the full data from the starting until the ending year (including zoom on months), the per month data for all the years, and the yearly average data having the choice to add the std bounds. Created using Matlab App designer.
Feel free to contact me for any more information!