- This code will allow an investor to quickly compare the performance of various portfolios.
- It categorizes key performance measures such as Cumulative Return, Standard Deviation, Beta, and the Sharpe Ratio by "Very Low","Low","Moderate",'High', and "Very High".
- The summary dataframe at the bottom is grouped by portfolio and sorted by their Sharpe ratios in descending order.
- Within seconds after running the program, the user can see which portfolio is the best, and which portfolio is the worst.
In its current state, the code only accepts csv files. So the user would have to download the csv file and let the code know where they are stored.
The user would also have to go in and change the names of the columns to represent the new files. In the future, I hope to change the code so that the user doesn't have to do this.
It would also be interesting to try and generate an automated report. In its current state, that is not possible. The user would have to write their own report at the bottom.
However, because the code essentially has a report in the form of a dataframe at the bottom, a written report can be accomplished fairly quickly.
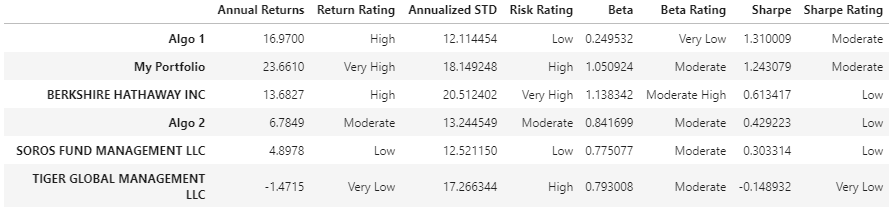
The sorted_portfolio above is sorted by the sharpe ratio in decending order. The Sharpe ratio essentially describes a portfolio's bang for the buck or risk adjusted return. The portfolio with the most bang for the buck was still Algo 1. Algo 1's Sharpe ratio was an impressive 1.38, which was 0.07 points less than my portfolio's ratio. Both Algo 1 and my Sharpe ratios were more than double the next contender; Berkshire.
In terms of annualized returns, my portfolio had a return o 23.66%, which was much higher than any other portfolio in the line up. The next highest was Algo 1, which had a return of 16.97%.
The most risky portfolio was still Berkshire's. However, my portfolio was second highest. Note how Algo 1 is 6th in line on that list. As the Sharpe ratio already shows, that is pretty impressive relative to the returns it was able to bring in.
Algo 2 had the 4th riskiest portfolio. Considering the extremely modest returns it had, this is not a good sign.
Algo 1 also had the lowest beta which was 0.25. This means that it's returns were least correlated to market returns and viewed the least risky of the lot. Considering it's returns, it would be an excellent addition to an investor's portfolio.
The portfolio with the highest beta was Berkshire at 1.14 with mine trailing close behind at 1.13.