Use Metrics Visualisations from GrandPrix#42
Conversation
|
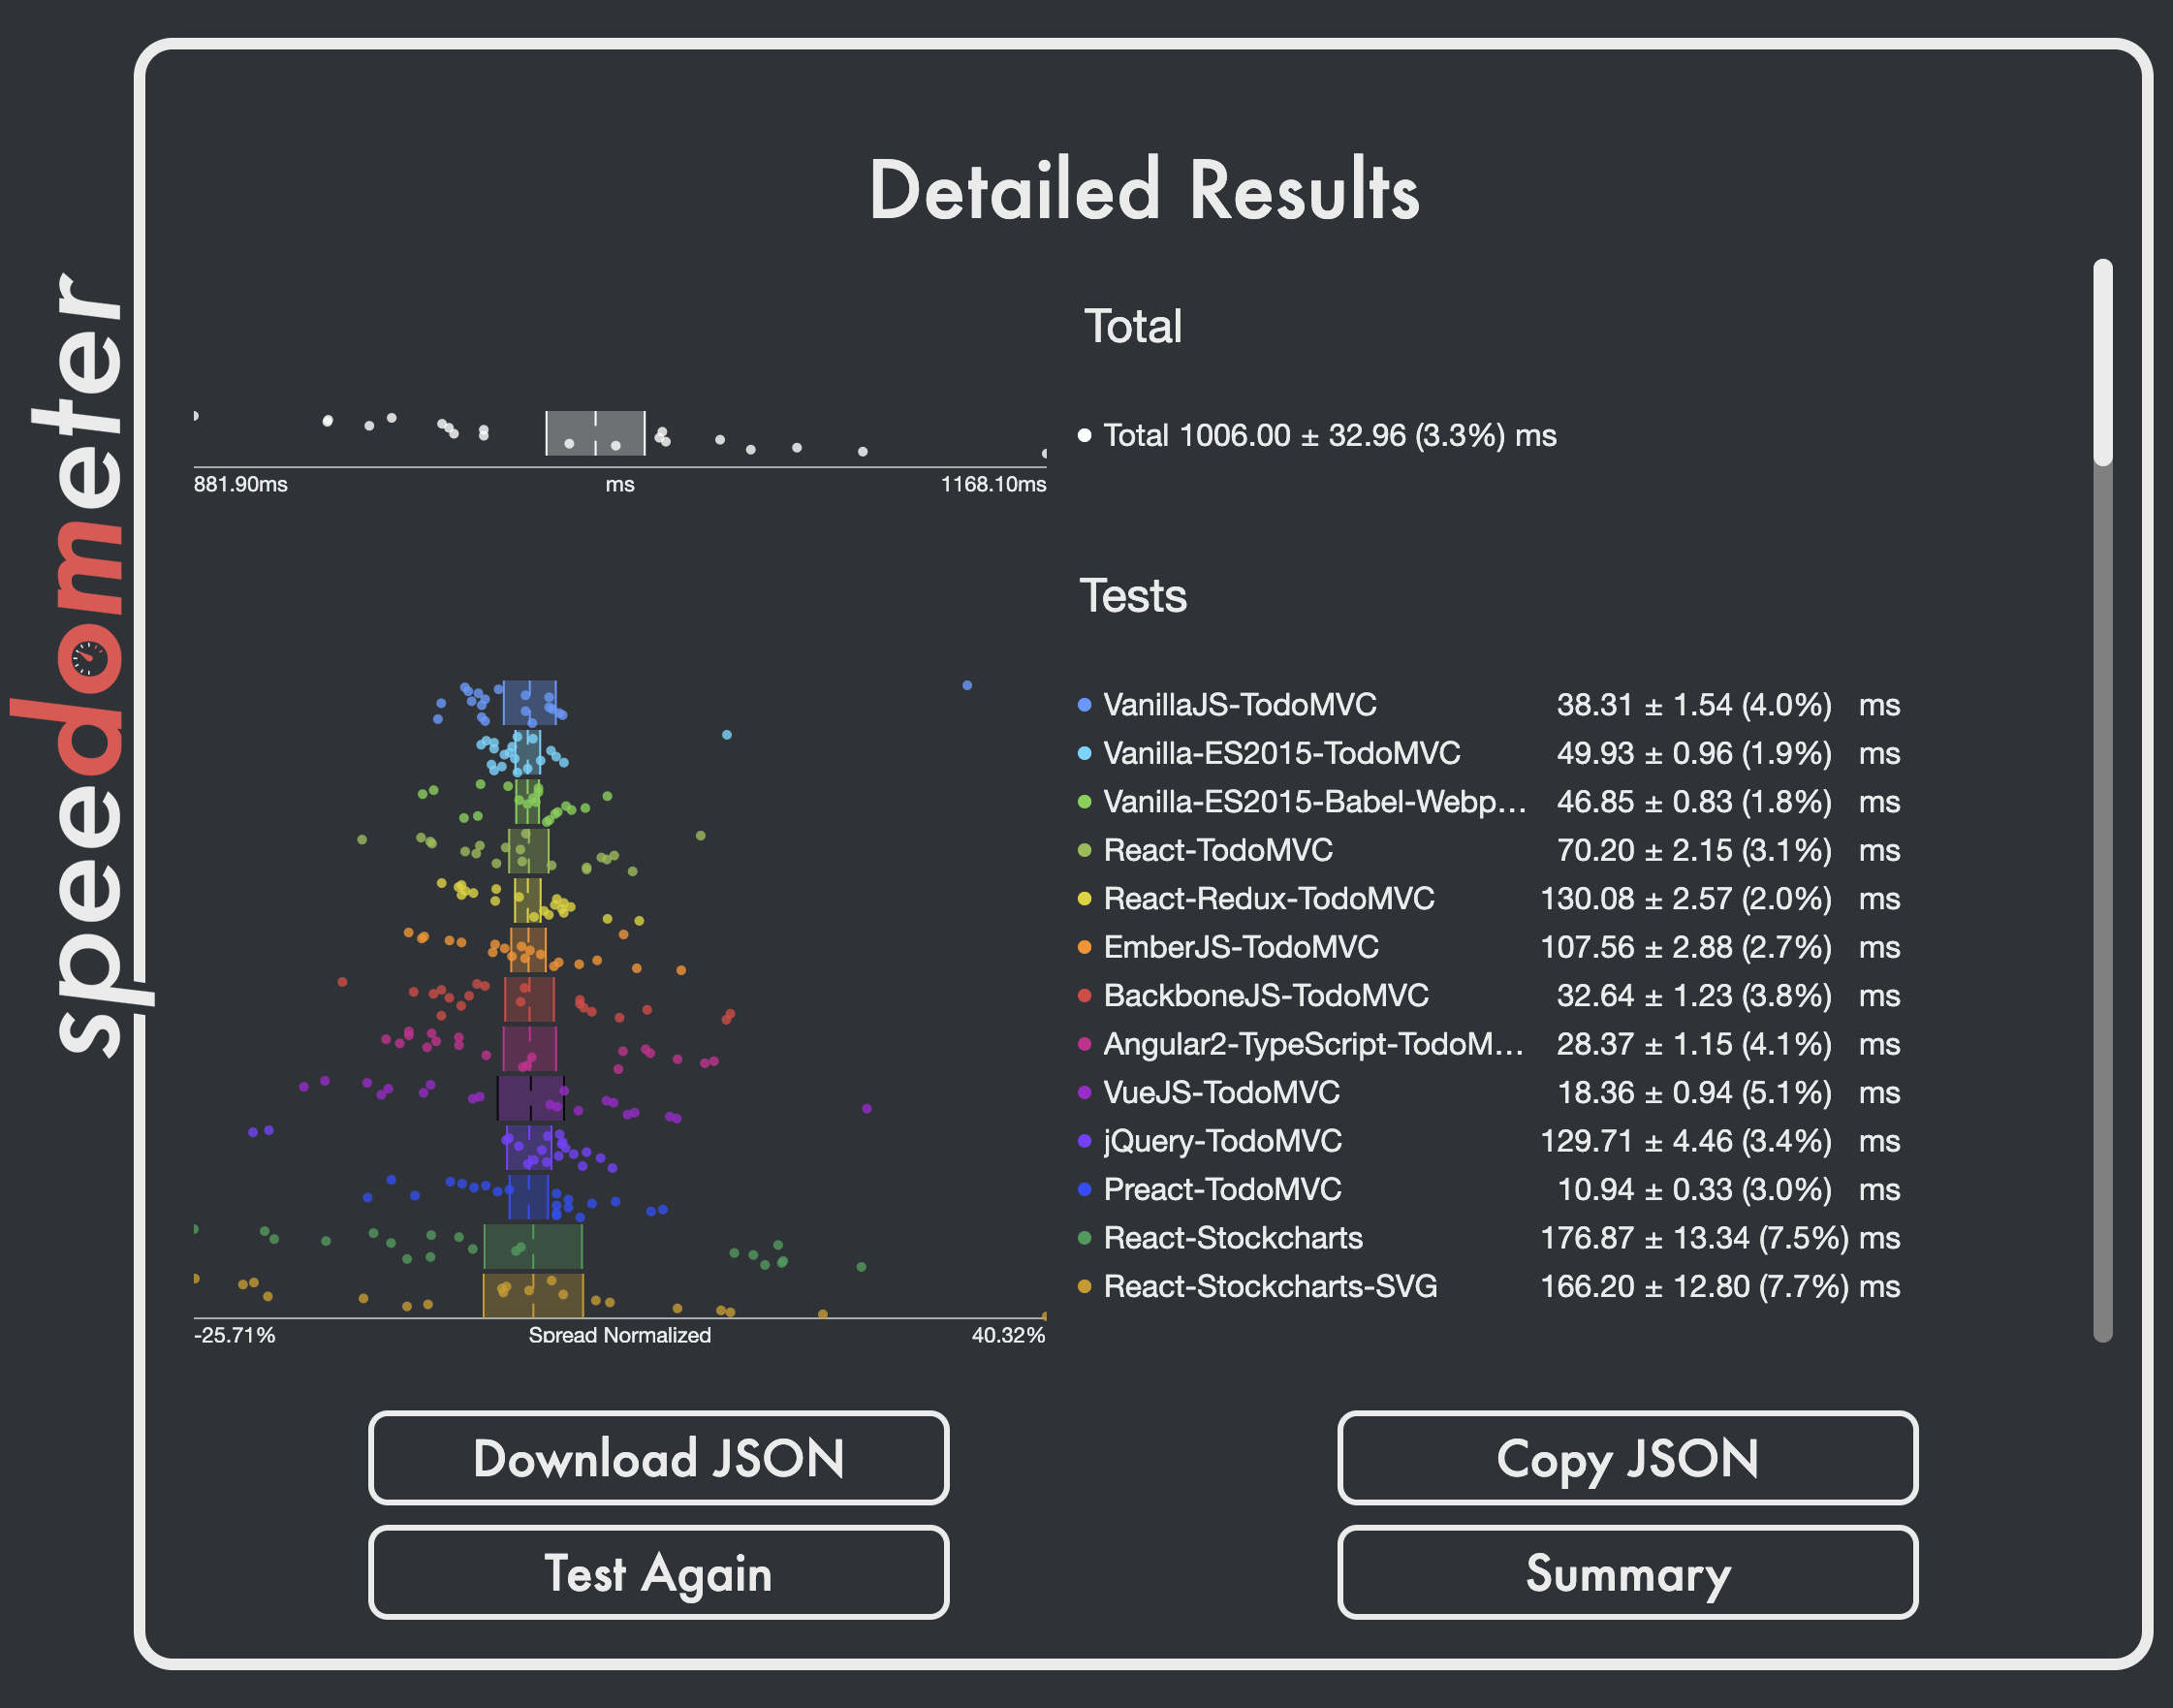
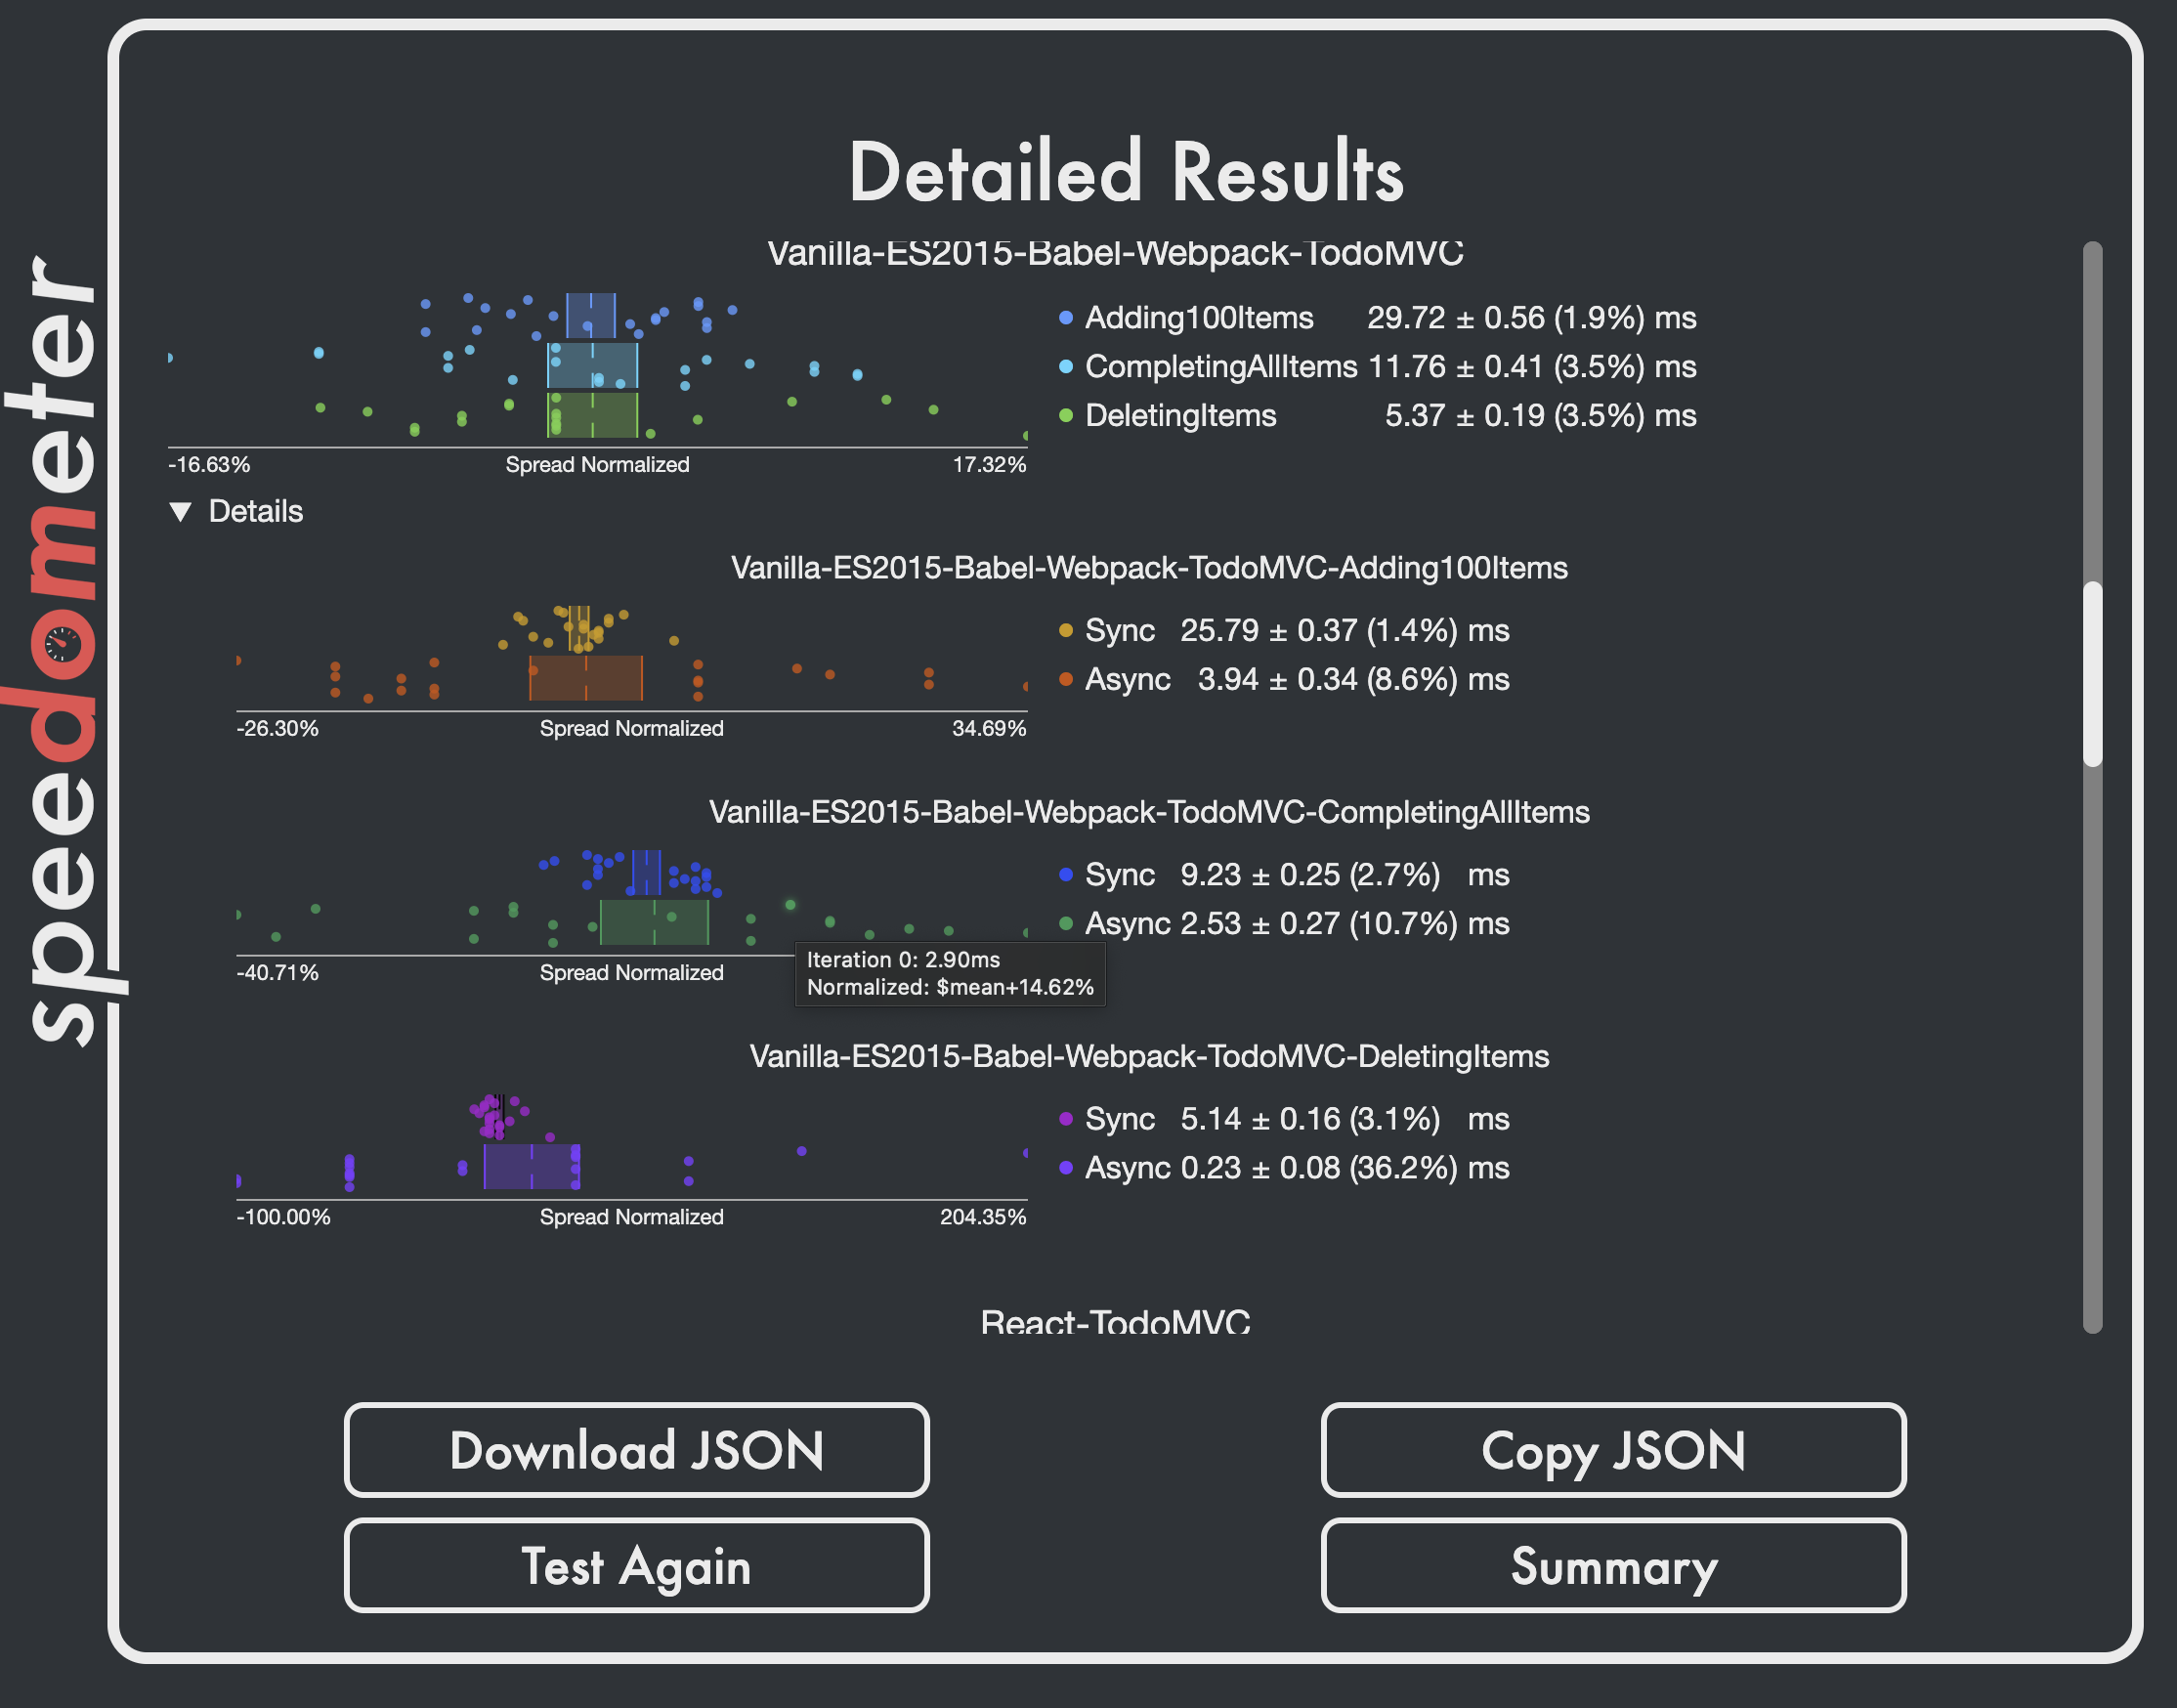
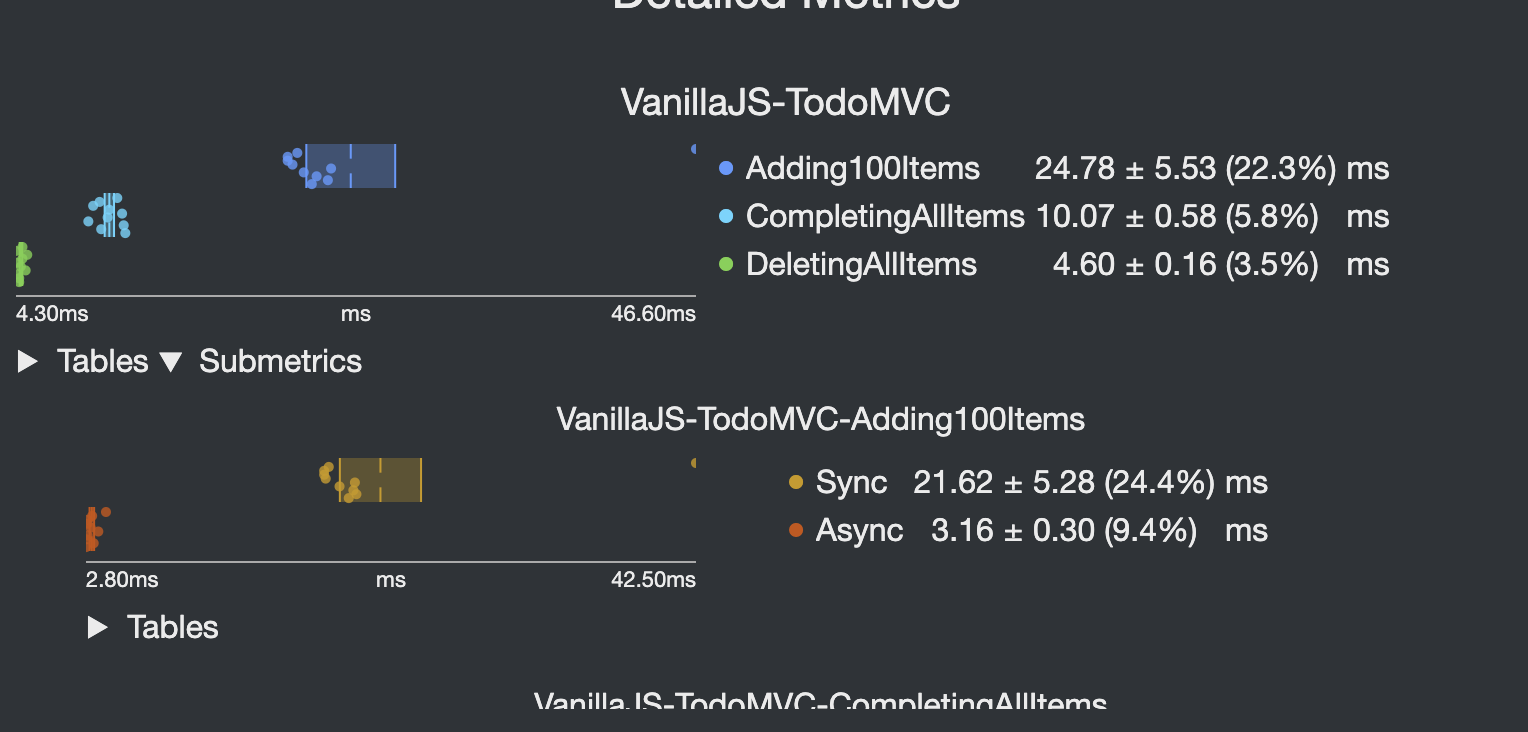
Example graphs: |
- Use buttons for "about" links
- Make sure about text is readable on all view sizes (adding optional scrollbar)
- Add button-row to allow for more complex buttons in the upcoming details view (see PR "Use Metrics classes from GrandPrix" #42 )
- Add `--foreground-color` and `--text-width` CSS variables
- Hide screen-size warning on startup to avoid flickering
- Fix main view centering by using more detailed calc(...)
|
This should be ready for review now. Happy to take feedback. |
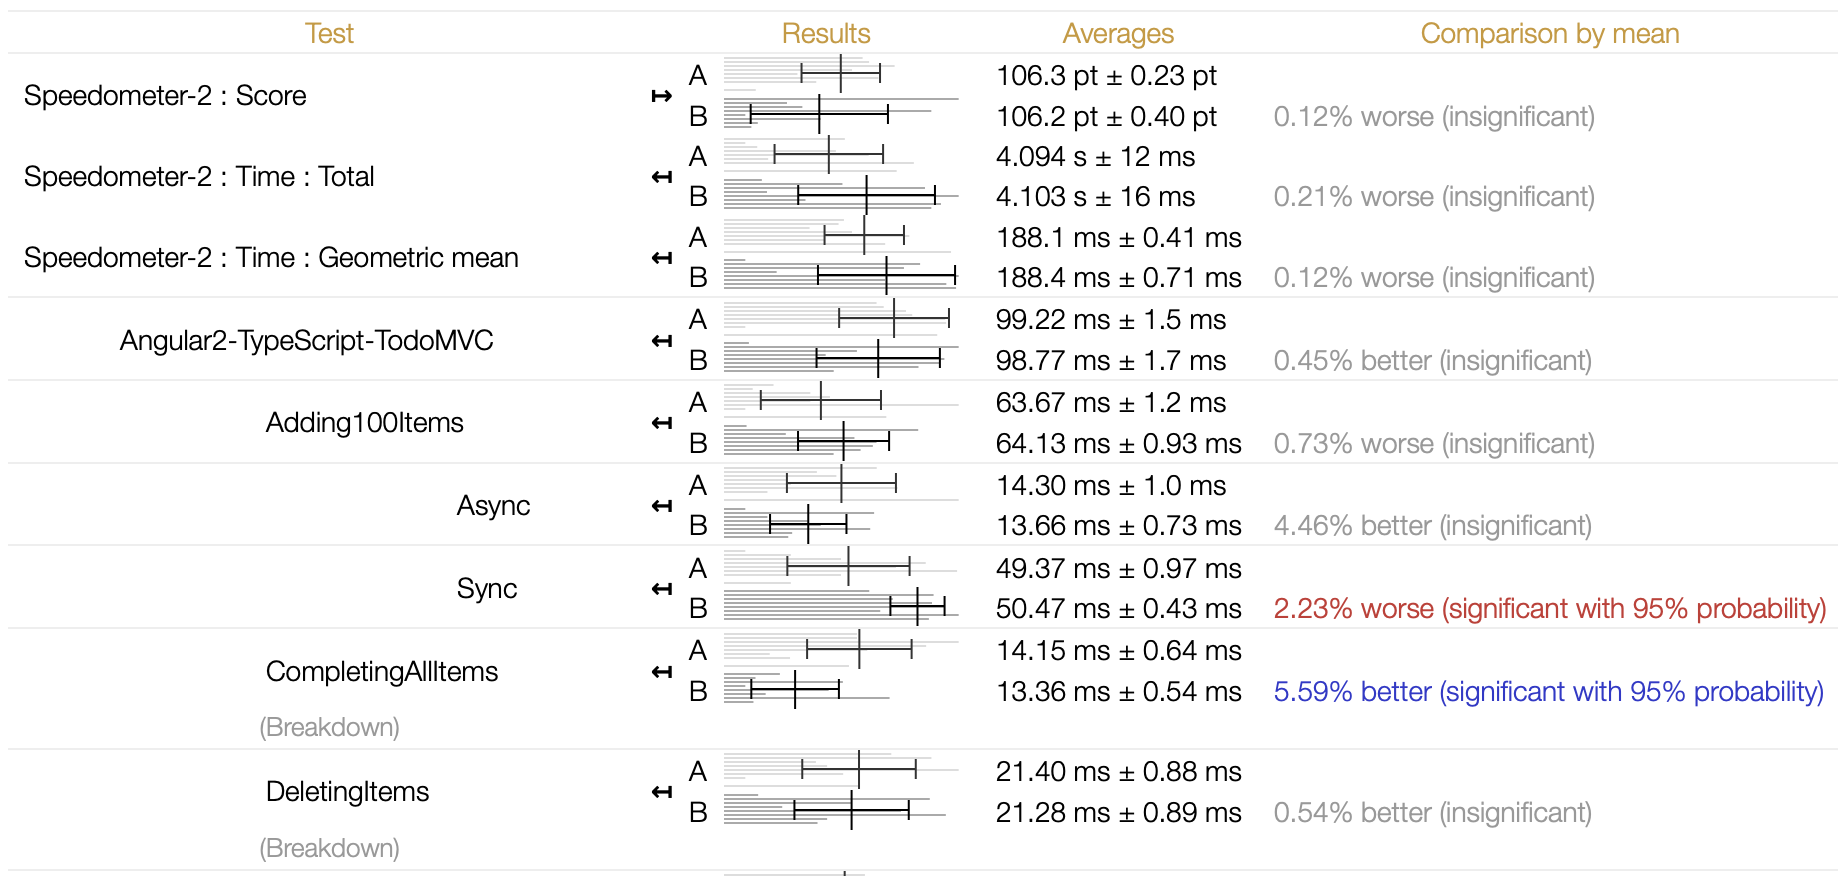
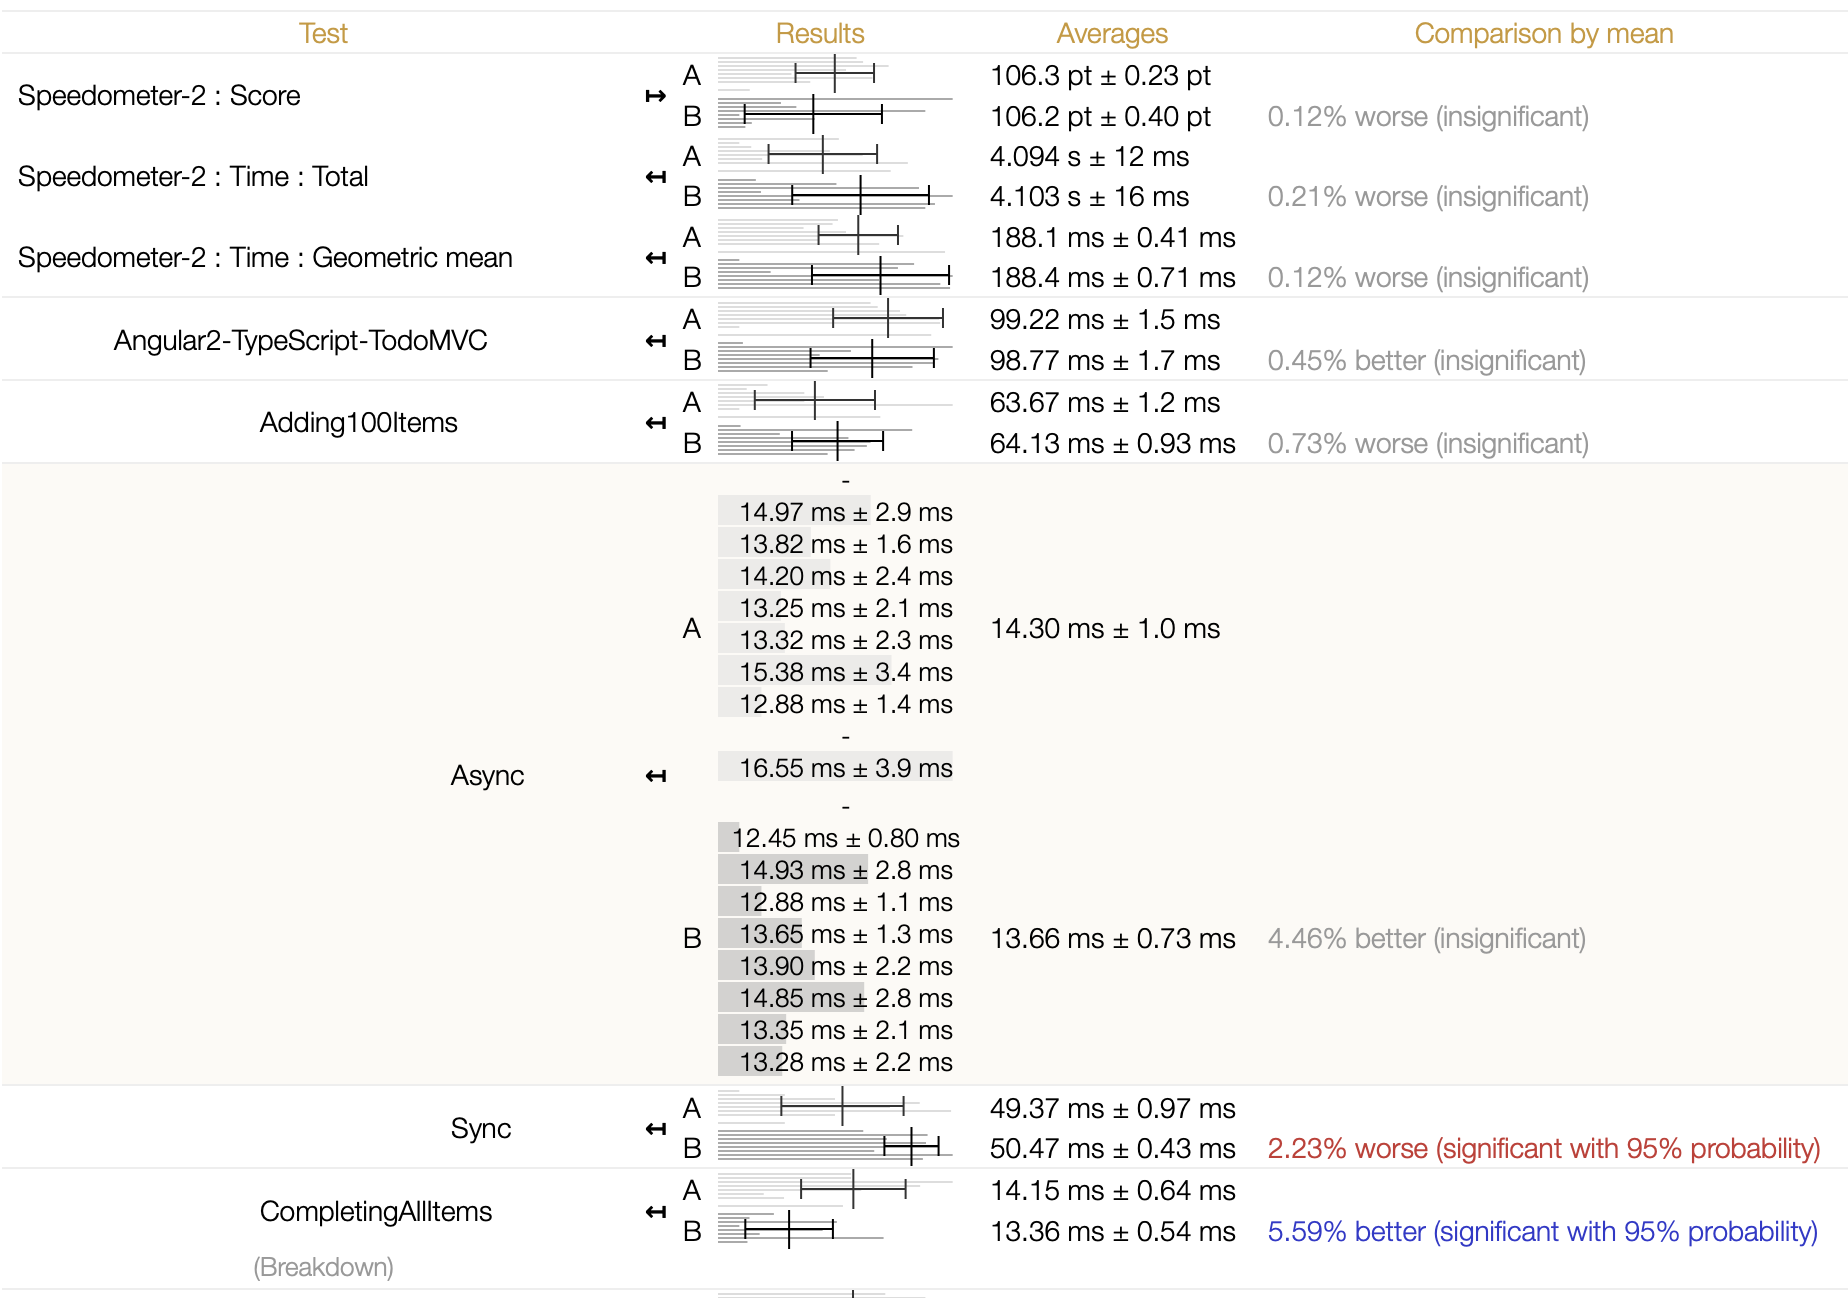
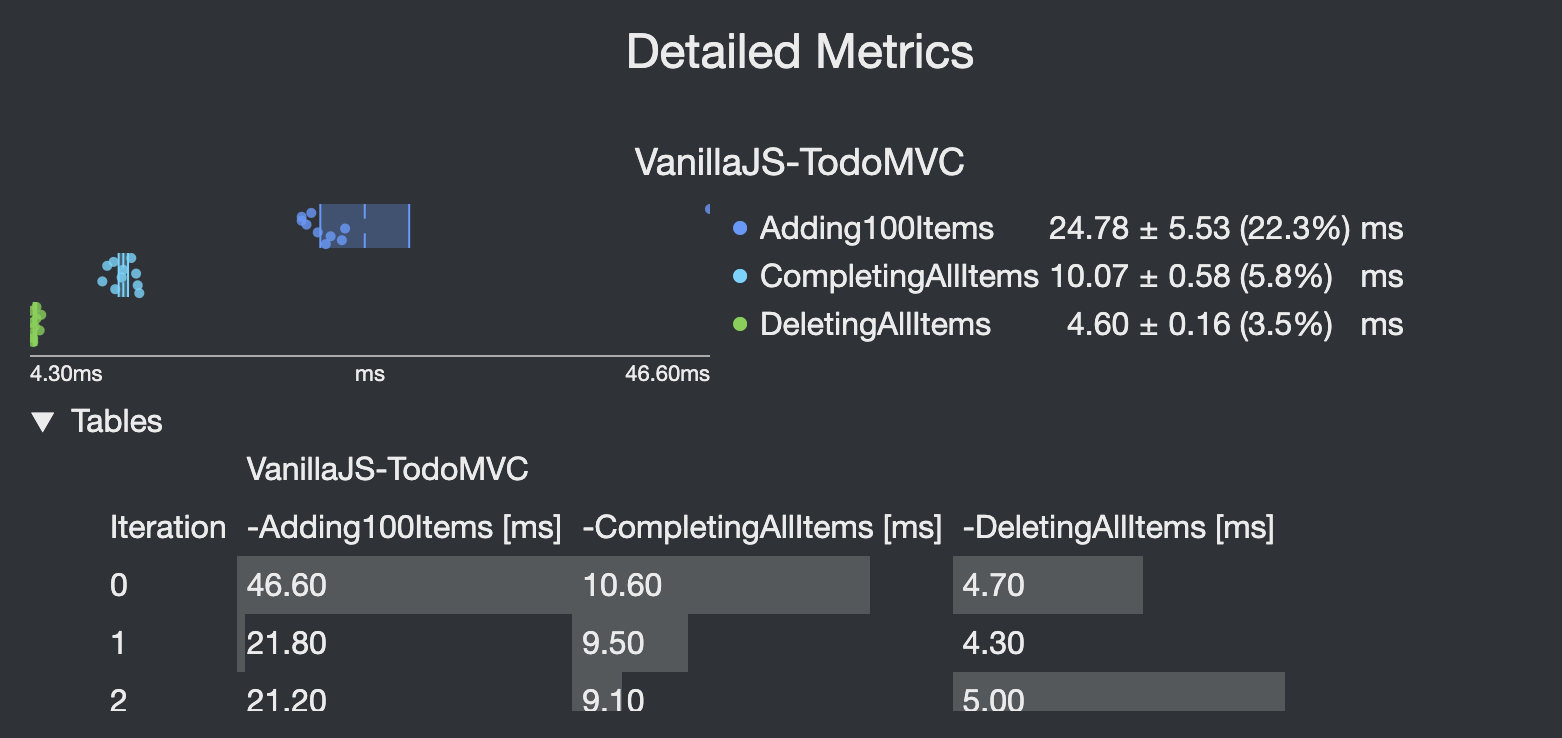
Nice. Being able to switch between two modes is useful. Hovering over each data point to see each data point's raw value seems too hard to do in practice though. Many points are overlapping one another or at the edges. How about toggling between scatter plots & tabular view. We have an internal performance dashboard, which uses horizontal bar graphs to show variance across different subtests: Clicking on one of those charts expand it to show the data in tabular form: This UI is more optimized for comparing two results (A vs B here) but I find this way of visualization & ability to drill down to individual iteration's data to be highly useful. |
|
I think this looks like a great improvement, thanks @camillobruni!
I agree that looks quite nice, but I wouldn't want to prevent incremental improvements from landing before a new UI was developed. Can this be moved into a follow up issue, where we can discuss in more detail (including the idea of a compare UI)? |
|
Another idea we could discuss in a follow up is using a dialog element or another overlay to present the detailed info (so that it's not constrained within the default viewport for the runner itself). I did this in a prototype used to research data grids at https://bgrins.github.io/data-ui-tests/?autorun and found it was a nice way to surface more detailed info than trying to fit it into the rest of the page. |
|
I like rniwa's suggestion, I definitely use this approach on a separate evaluation page to compare between multiple runs. Given that we can easily download the data now, the details page should mostly help with assessing the run quality (aka how much noise there is and how data is dstributed).
|
|
|
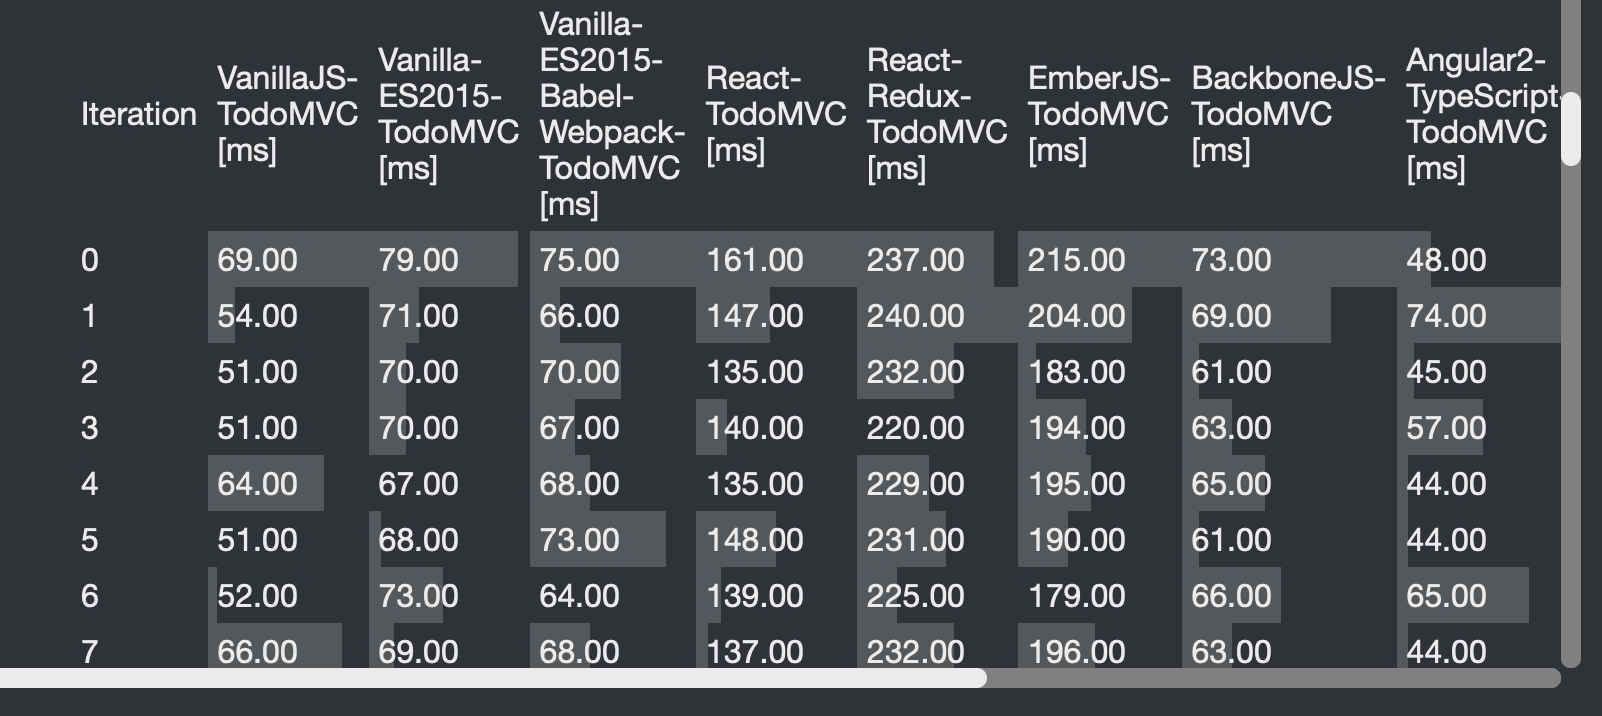
Hm... can we flip the rows & columns of the tables? Test names are too compressed & horizontal scrolling bar is quite painful to use.
|
| .map( | ||
| (metric, i) => ` | ||
| <tr > | ||
| <td class=${colors[i % colors.length]} >●</td> |
There was a problem hiding this comment.
Are we sure all these values come from trusted sources and not via query parameters, etc...?
I don't want us to have XSS vulnerabilities.
There was a problem hiding this comment.
- I've now renamed
paramstoviewParamsto make a bit more clear that they are not related. - params.mjs parses all input data (except for
params.suites) to int and bool - params.suites is checked against a known list of Suites.keys() in runBenchmark
The input values to renderMetricView are only extracted from the metrics themselves which have values coming only from the runner.
Another thing we could do is when in the details view set |
|
 rniwa
left a comment
rniwa
left a comment
There was a problem hiding this comment.
I think we want to do a bunch of style tweaks but that can be done separately.
This PR makes each runner section independent to allow custom sizes.
This is in preparation for PR #42 to allow more space for the details view.

- Move border layout from `main` to each `section`
- Copy logo into every `section`
- Use grid-layout for header/content/footer in about and details view
Uh oh!
There was an error while loading. Please reload this page.