This dataset is taken from UC Irvine's treasure trove of datasets. Source:http://archive.ics.uci.edu/ml/datasets/Wine+Quality,
Linear Regression
Random Forest
Weighted KNN
1.Exploration
red wine dataset contains 1,599 obs with 12 variables and wine quality ranges from 3 to 8 white wine dataset contains 4,898 obs with 12 variables and wine quality ranges from 3 to 9
compared with red wine, the white wine has higher amount of residual sugar and sulfur dioxide and similar pH value
 Based on the distribution of wine quality, I create a new variable – rating which classify the quality into three categories, bad for quality lower than 5, good for quality higher than 7 and average is between those two. What I find is that rating in red wine is 63 for bad, 1319 for average and 217 for good, while in white wine is 183 for bad, 4080 for average and 635 for good. Thus, 82% of wine are in average quality. Therefore, it is possible that the provided data might have some influence on further prediction due to lacking enough samples on edge quality.
2.Model Development
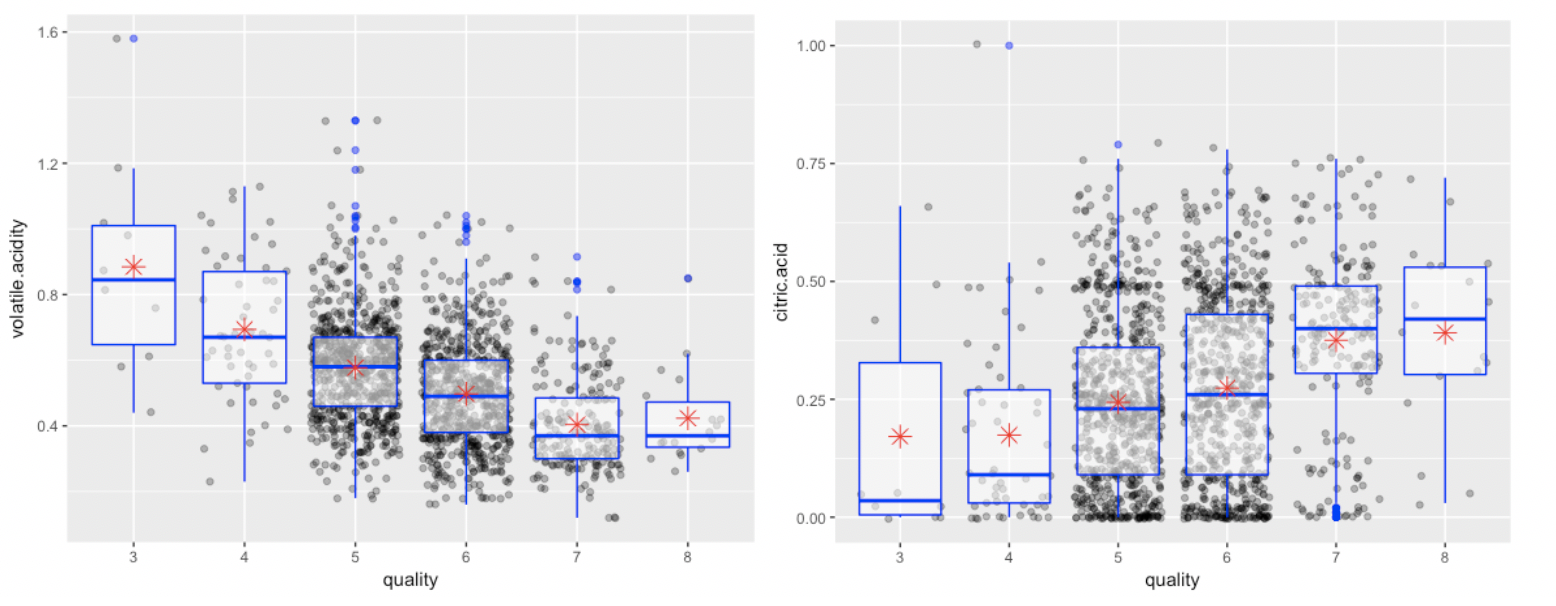
Key factors determines the wine quality: pH value, alcohol content, density and acidity level
Box Plot of wine variables:
For the linear regression: the red/white wine dataset, I log the Sulphates into a new variable “newsul”. The best performance model contains alcohol, new Sulphates, volatile acidity, citric acid and fixed acidity.
 In this figure, we can see that the best quality wines have high values of both alcohol percentage and Sulphates concentration, so the higher the contents the better the wine quality. Even though there is a downward trend of high quality, it can be treated as the when the concentration of alcohol is higher, Sulphates tend to be lower in good quality wine. For the bad quality wine, the alcohol and Sulphates level are relatively lower than other higher quality wine, and the reduction of percentage of alcohol level is more significant than Sulphates.
The prediction rate in Red Wine is 60.8% on test set, and the RMSE is 63.8%. While in the white wine, the prediction rate is 50.3% and the RMSE is 76.8%. Although both two prediction rates are not as impressive as I imagined before, the red wine seems to have a higher prediction rate than white wine with lower RMSE value.
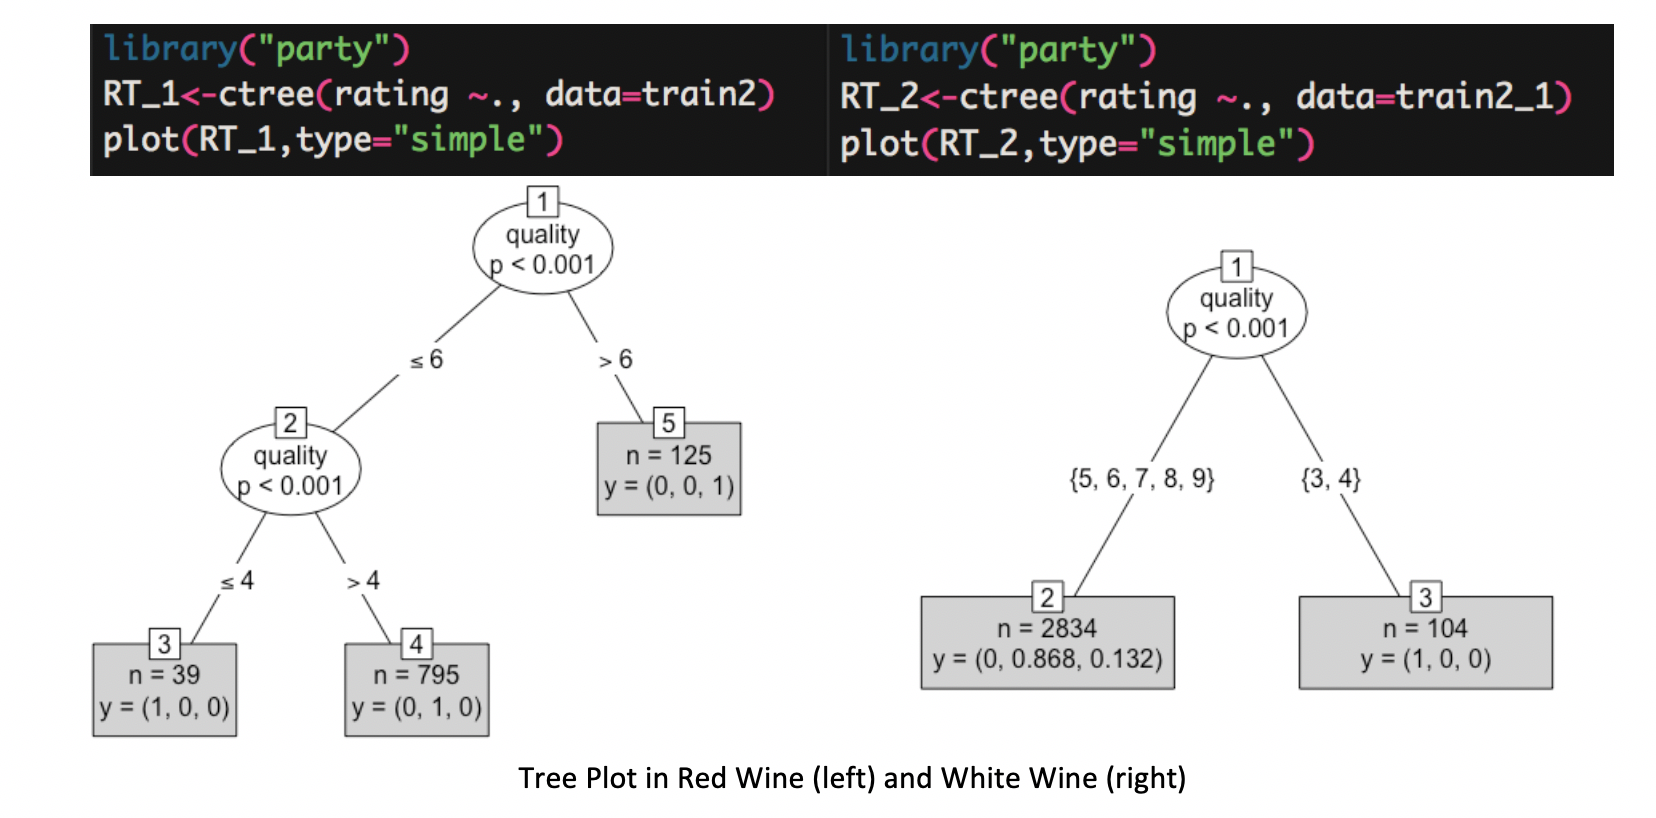
For the random forest, I split the dataset into train (60%) and test (40%) set. Based on the figure below, we can find that the estimate error rate in red wine is 14.2%, so the predicted accuracy is 85.8%, which is higher than the linear regression model. Also, the predicted accuracy in white wine increase a lot, which is 82.8%.
For KNN, it is a great model to analyze the classification problem that can robust noisy training data and effective for the massive dataset.
Based on the figure below, in the red wine, the training model set k equals to 17 as the final value, which has the highest accuracy. Using confusion matrix, the overall statistics and the statistics by class are clearly indicate the model accuracy. The accuracy for red wine test set is 74.8%. For the white wine, the final value of K is 21 with the highest accuracy for the test set is 56.4%. It is obvious that KNN has a better performance on red wine dataset.
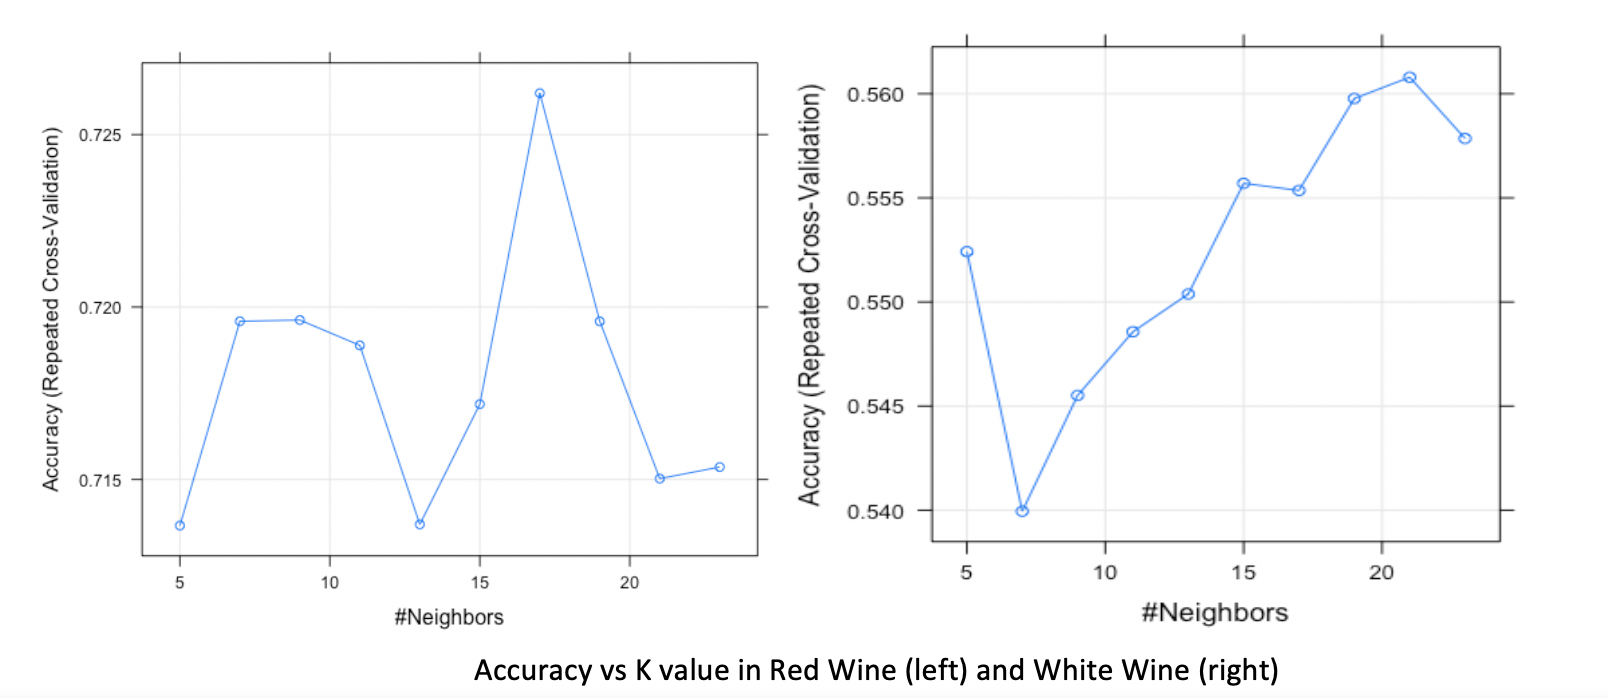
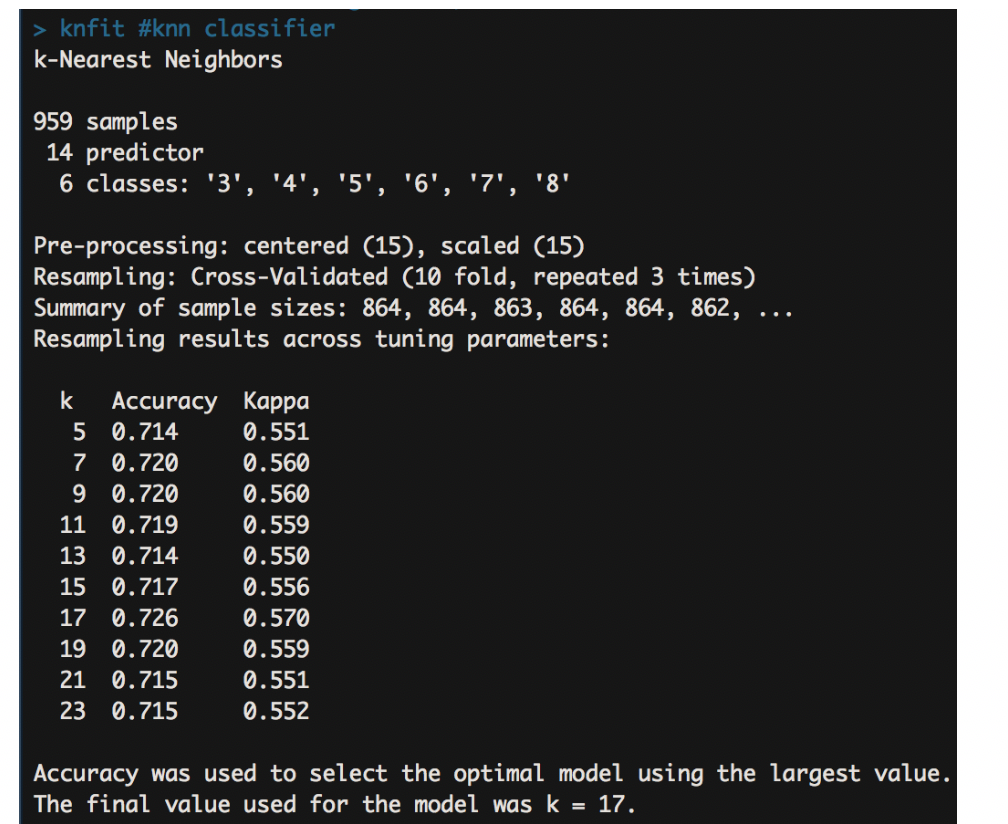
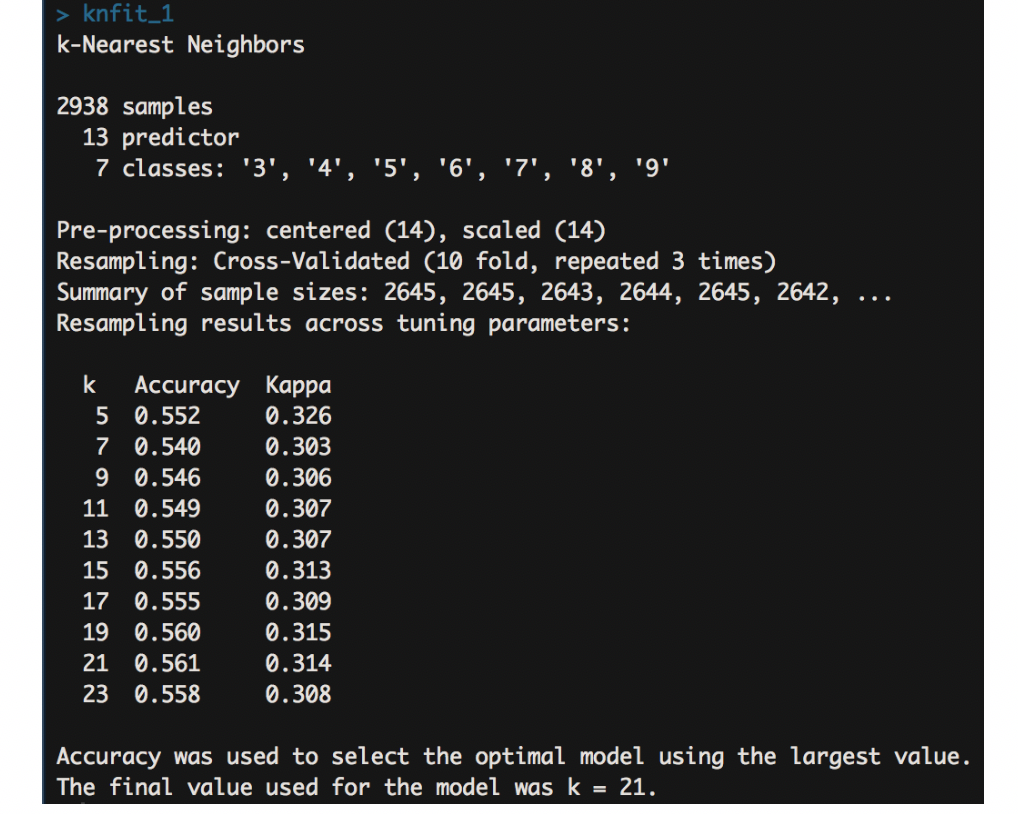
The KNN model shows the accuracy and Kappa metrics result for different K values. From the results, it automatically selects best k-value. Here, the model on red wine training chooses k=17 as the final value with the accuracy rate is 74.8%, and on white wine training chooses k=21 with accuracy rate is 56.4%.
3.Conclusion
Therefore, based on what I did on three different kinds of models and analyzing the performance on each model, I think the random forest has the best performance on red and white wine datasets.
4.Reference
Laurent Gatto. “An Introduction to Machine Learning with R”, Chapter 5 Supervised Learning, October 18th, 2017, https://lgatto.github.io/IntroMachineLearningWithR/supervised-learning.html
Akanksha Singh. “Explore and Summarize Red Wine Data Quality”, Kaggle, October 23, 2017, https://www.kaggle.com/singh123/red-wine-analysis-r
Teja Kodali. “Predicting wine quality using Random Forest”, R-bloggers, February 4th, 2016, https://www.r-bloggers.com/predicting-wine-quality-using-random-forests/
Rahul Saxena. “KNN R, K-nearest neighbor implementation in r using caret package”, Dataaspirant, January 9th, 2017, http://dataaspirant.com/2017/01/09/knn-implementation-r-using-caret-package/
Serigo Venturini. “Cross-Validation for predictive analytics using R”, MilanoR, May 3rd, 2016, http://www.milanor.net/blog/cross-validation-for-predictive-analytics-using-r/