Using Mapbox, D3, and Leaflet to map earthquakes
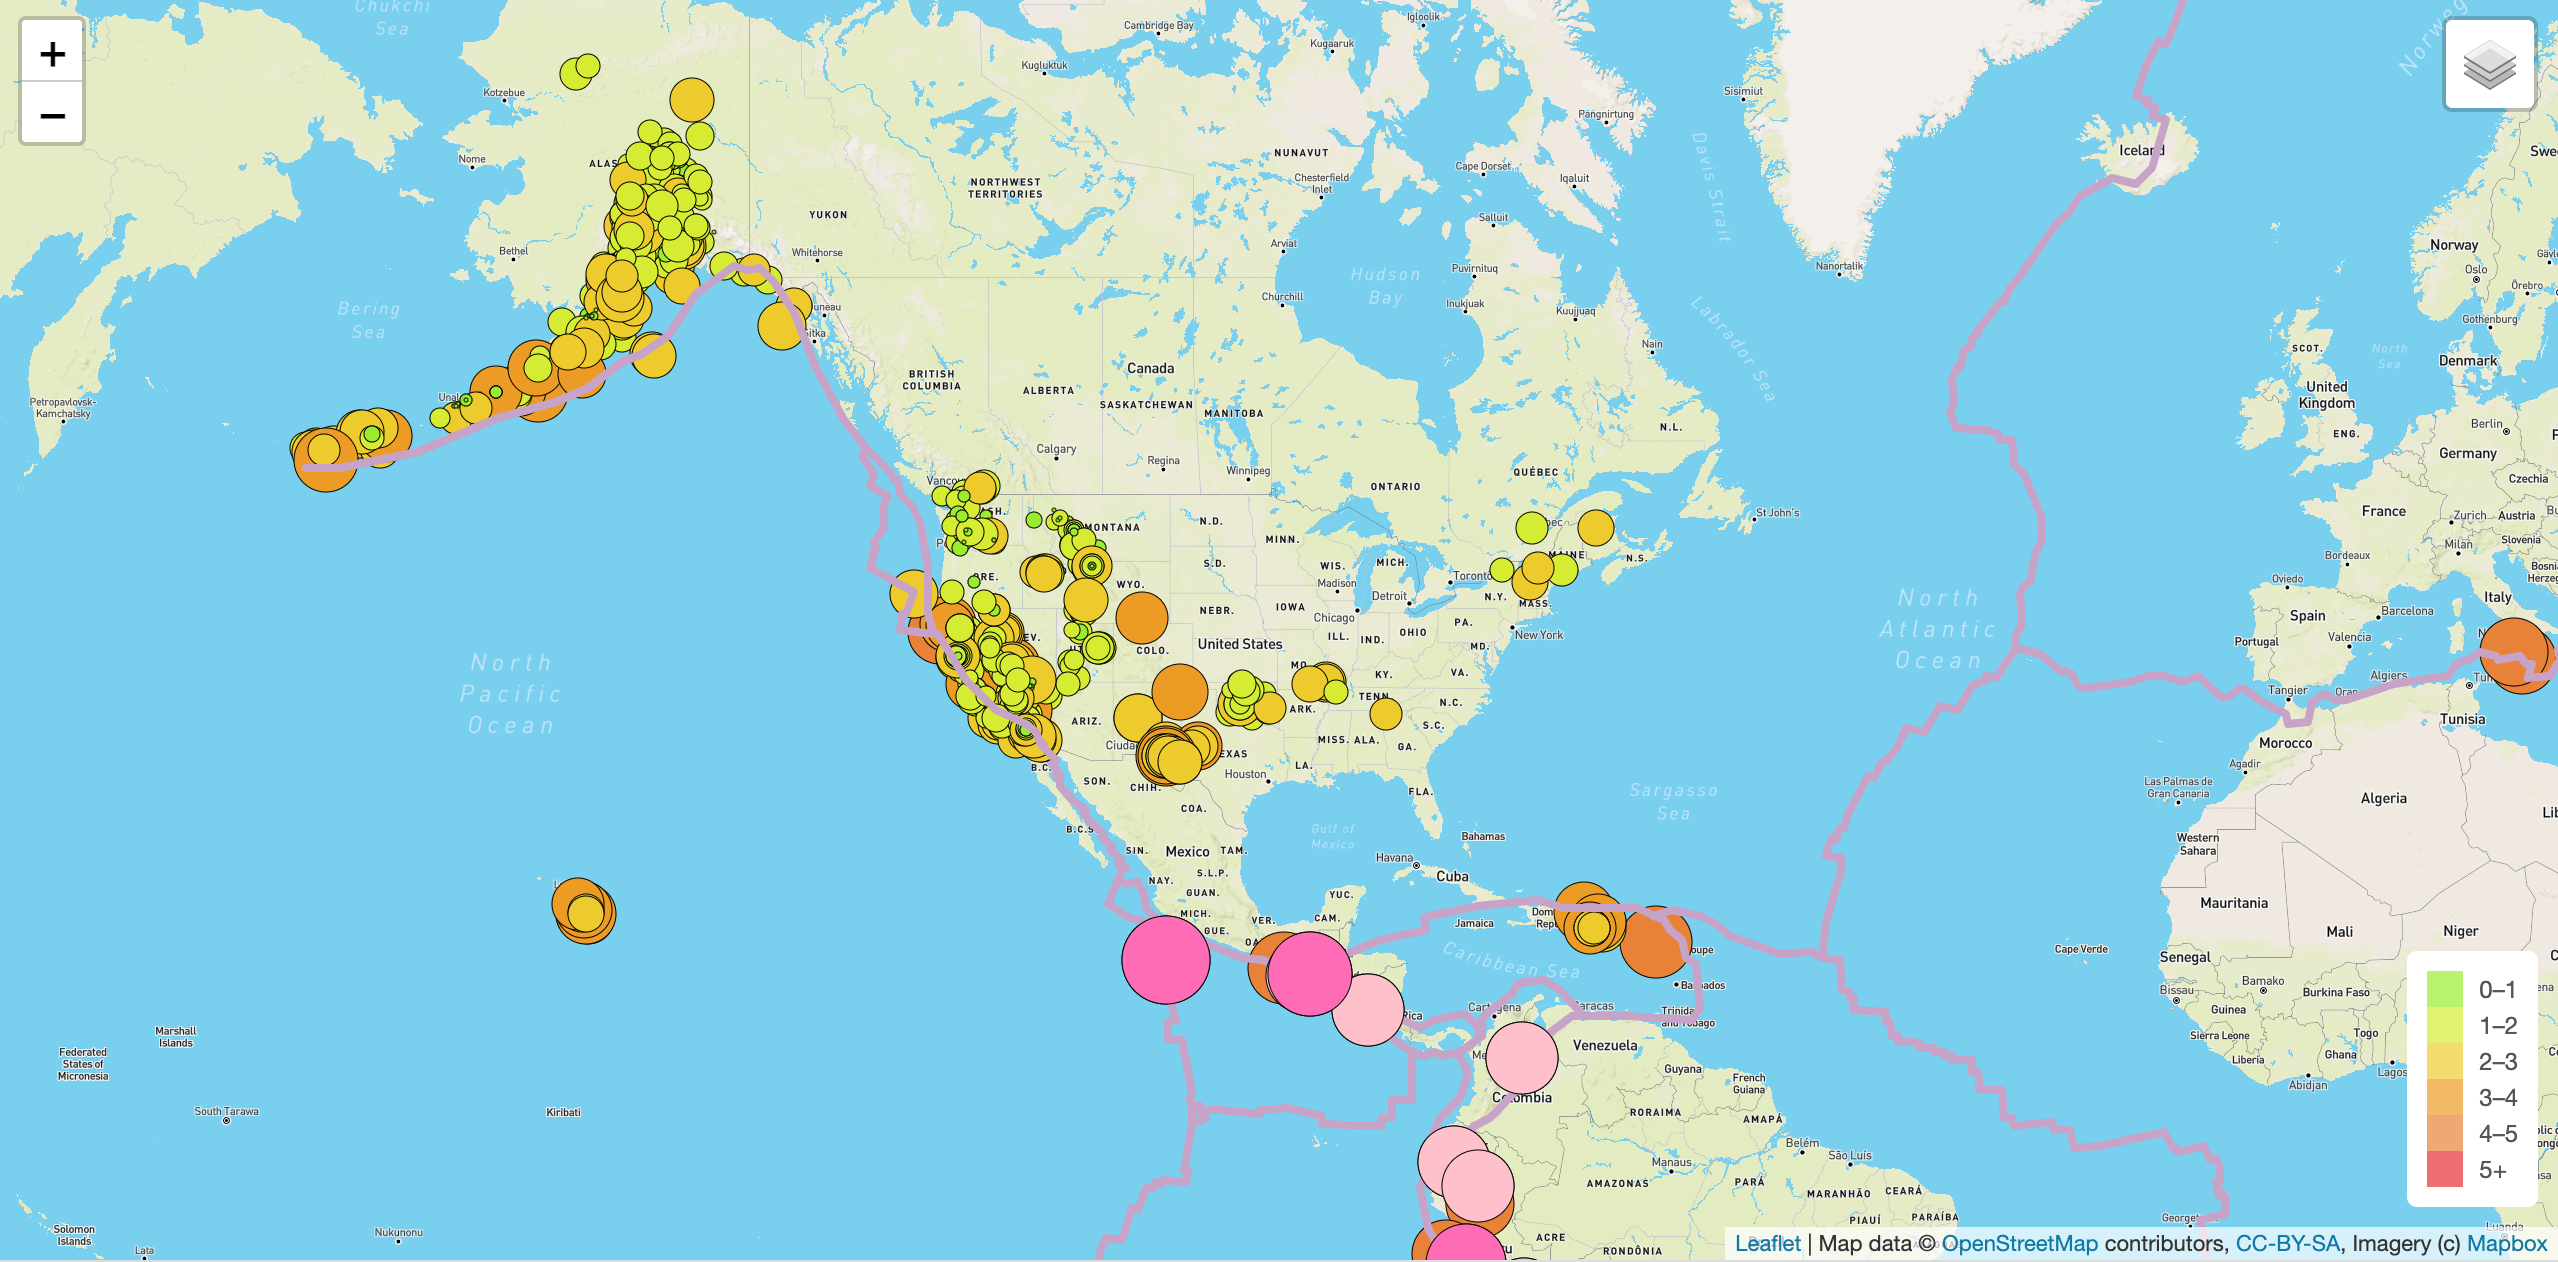
The purpose of this project was to build insightful data visualizations with interactive features of earthquakes from around the world. To support website and mobile application development the 2019 earthquake geoJSON data from the US Geological Survey Website was used to execute this project. By traversing and retrieving earthquake data using Javascript, the D3 and Leaflet libraries, the below Mapbox web application was created to plot the data via an API request.
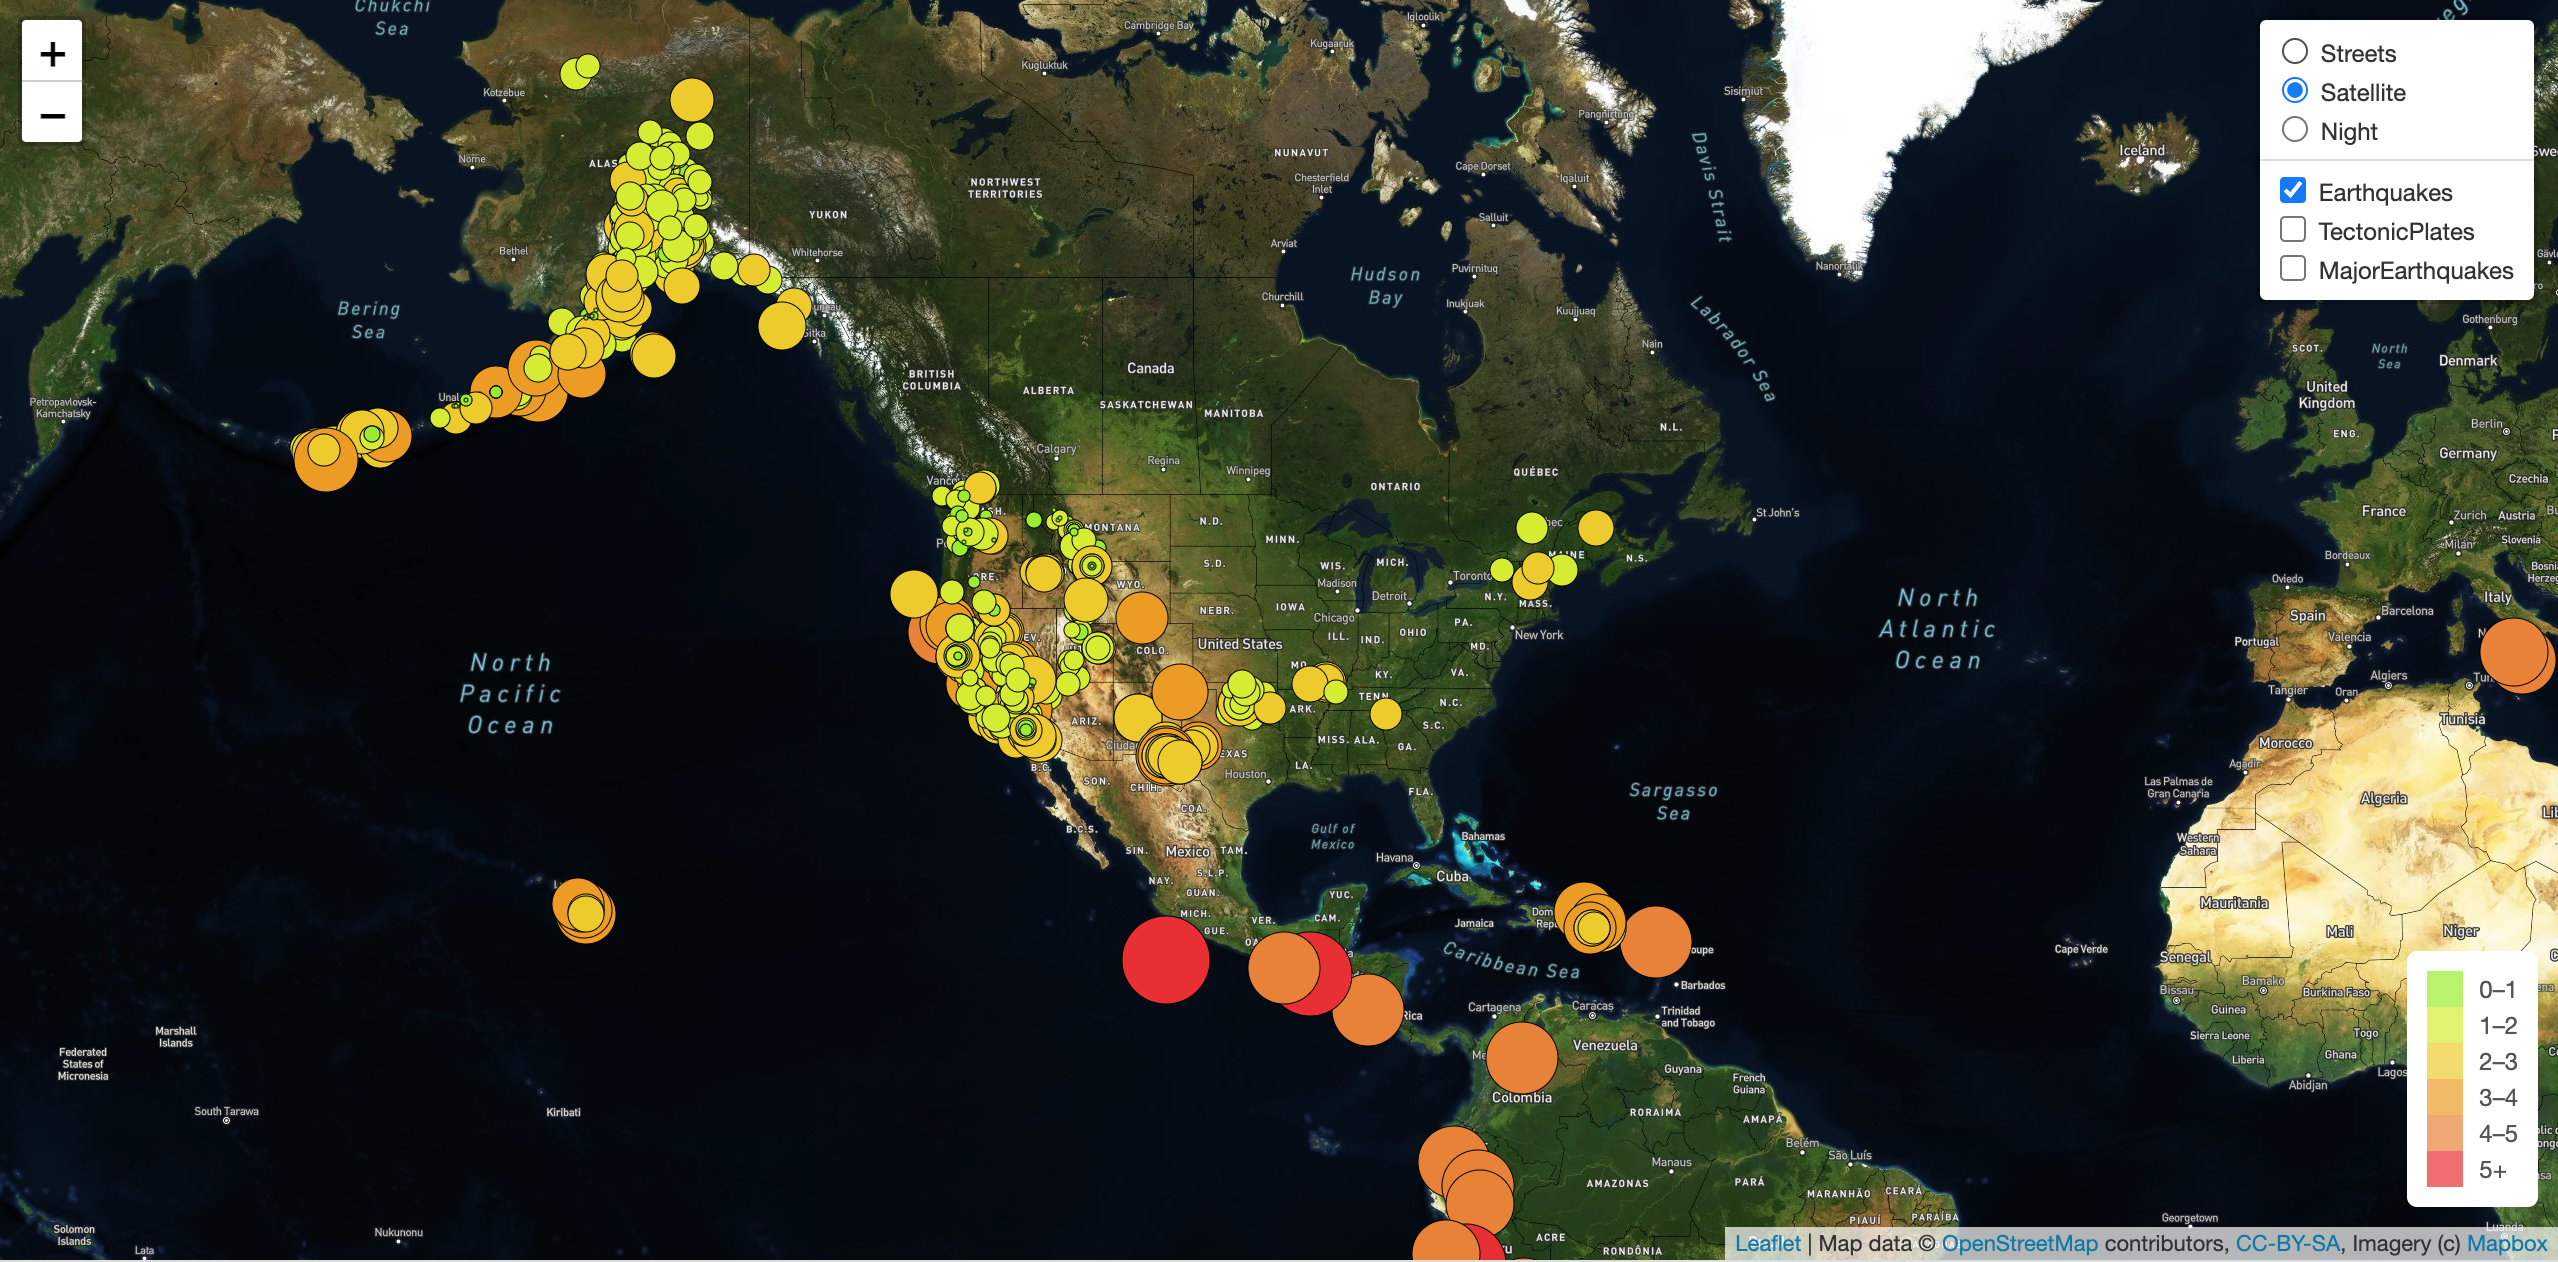
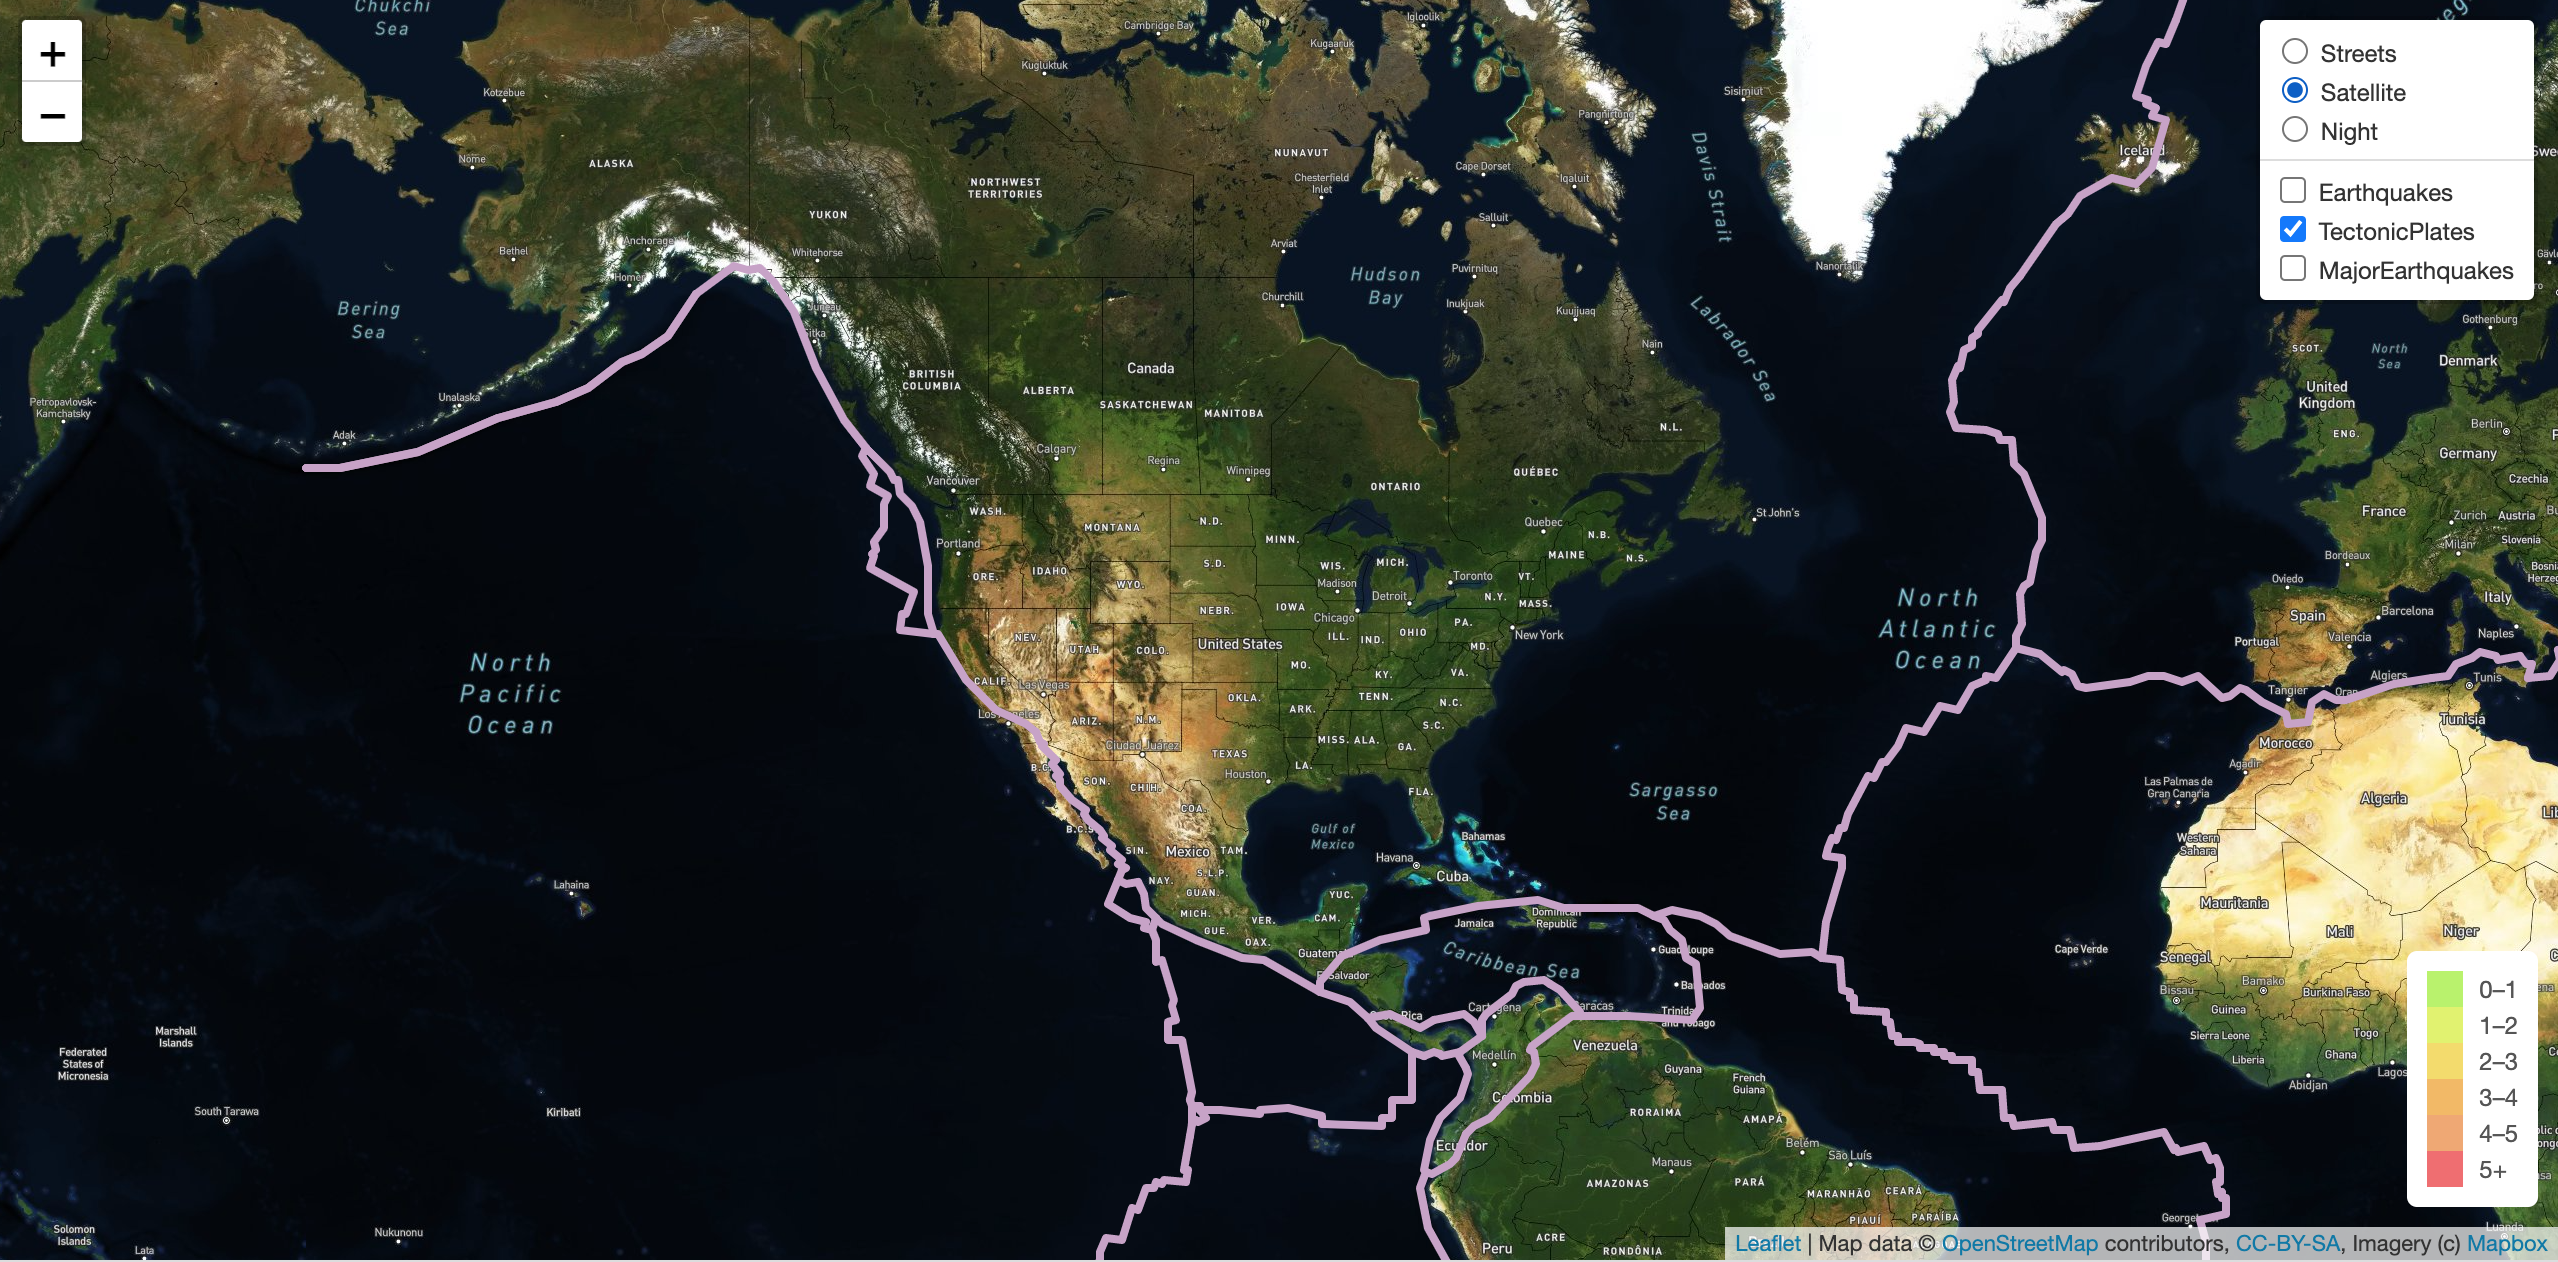
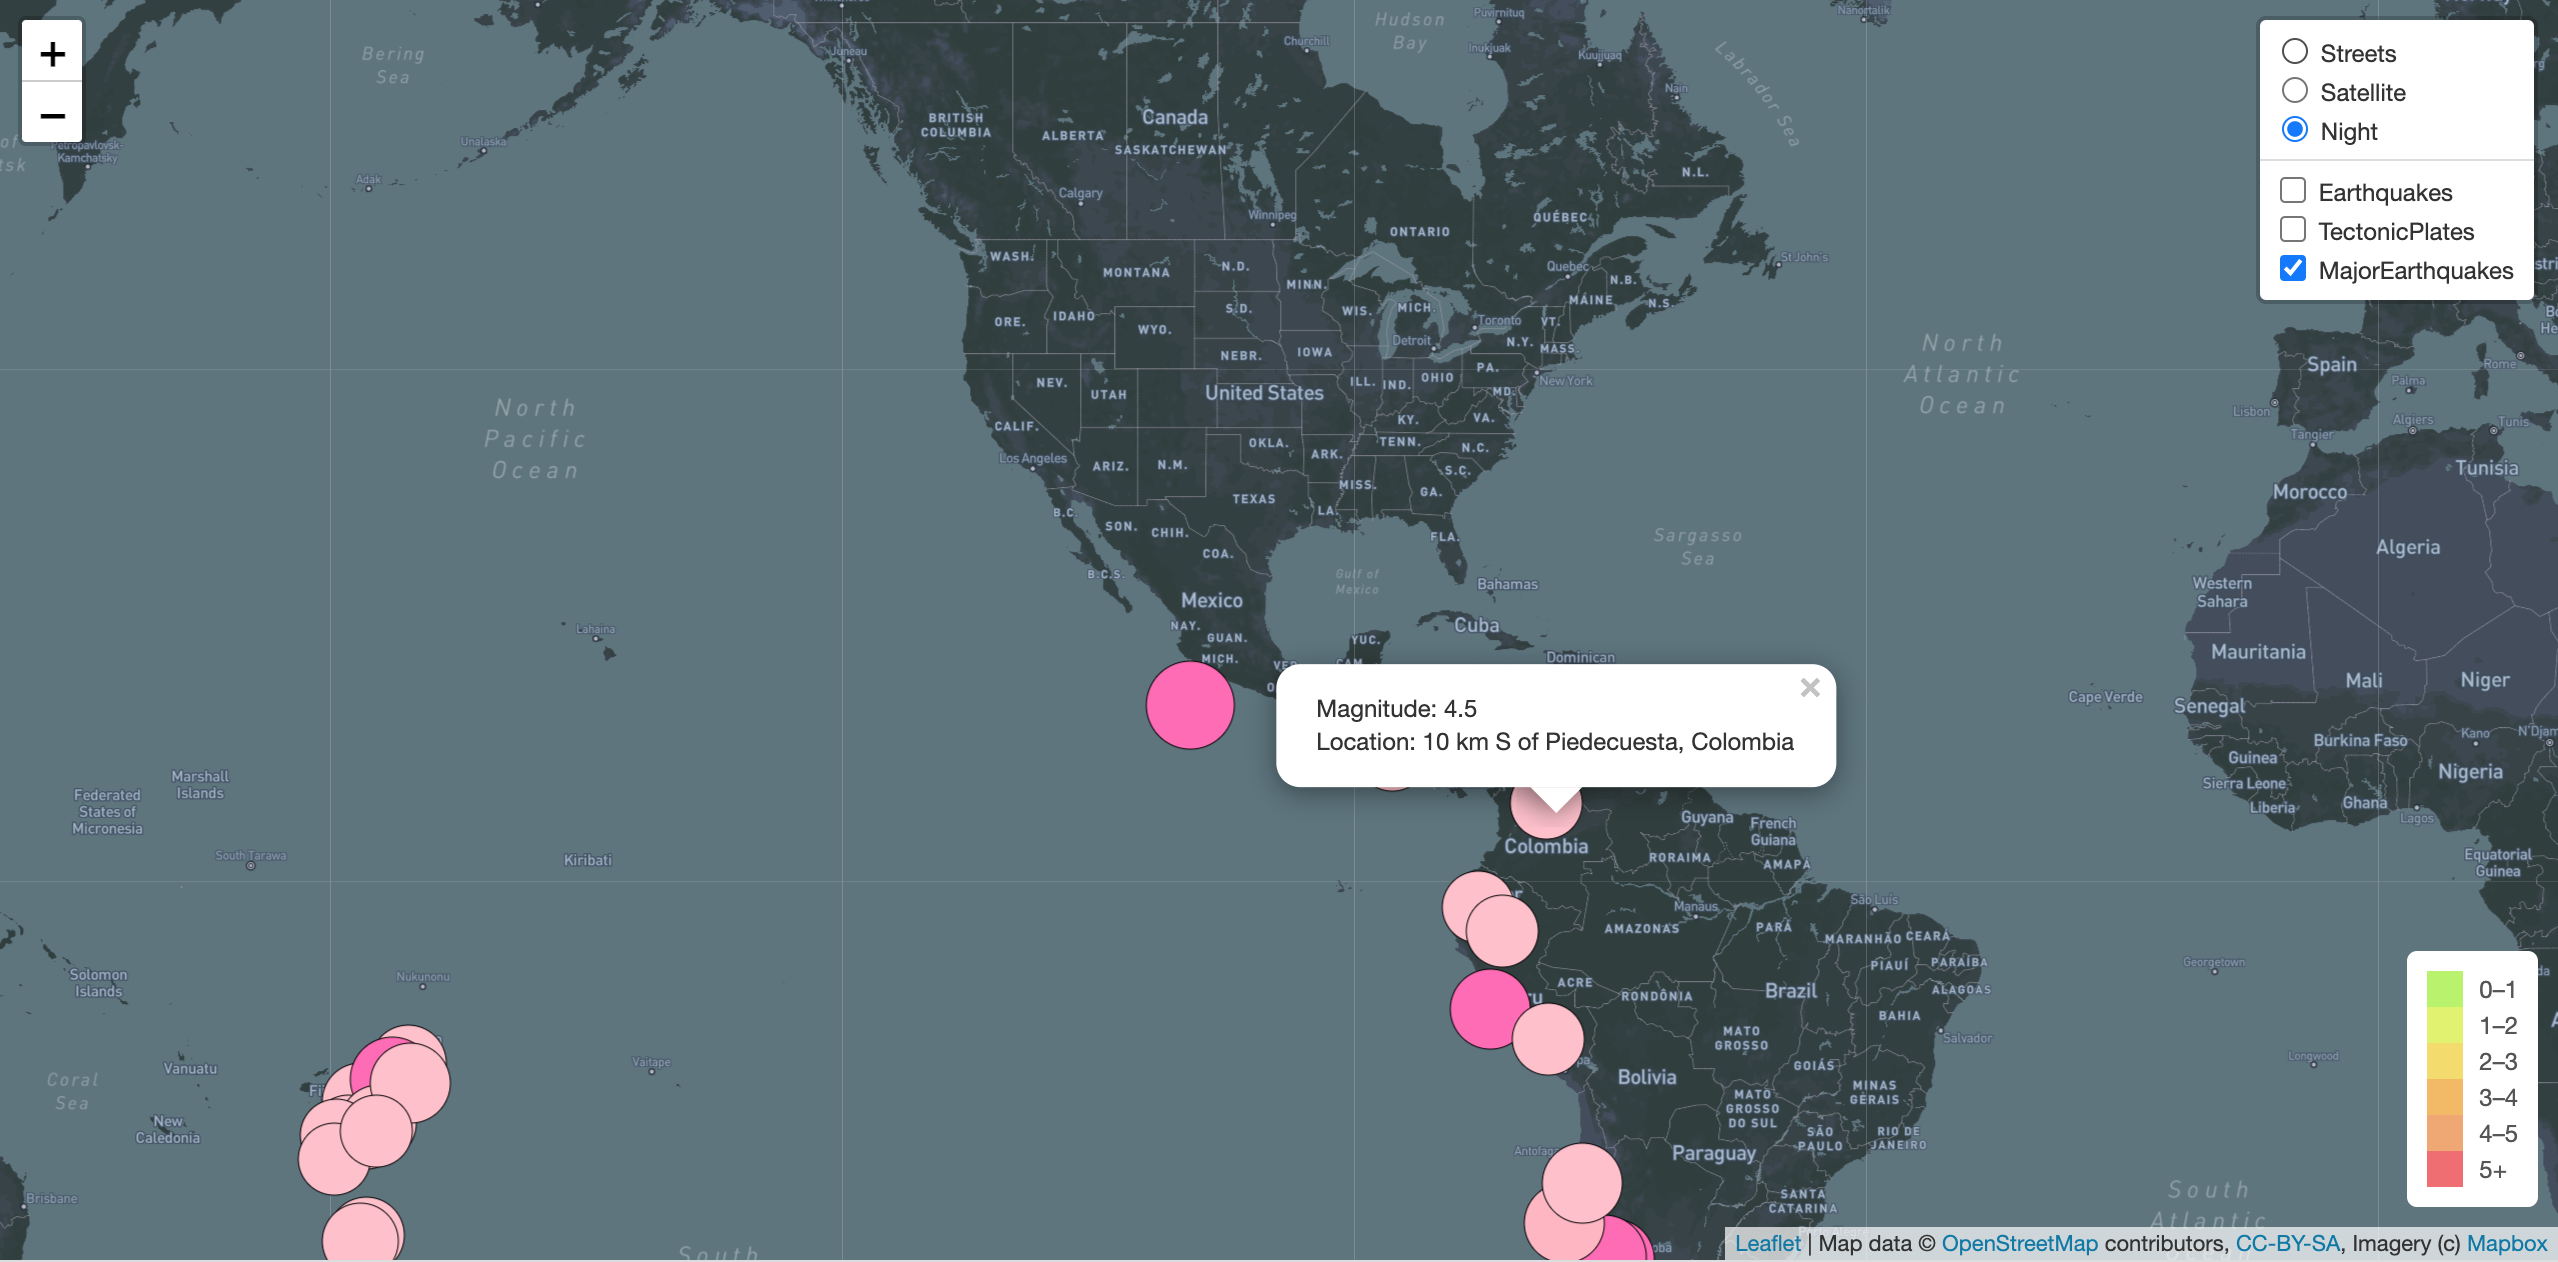
In the map images below, each earthquake is displayed with circle makers with the diameter indicating the magnitude of each earthquake. Boundaries for tectonic plates are also displayed using a linestring. Lastly, major earthquakes with a magnitude greater than 4.6 are displayed with pop-up markers noting the magnitude and location.