Generate and embed matplotlib figures directly in Inkscape
A powerful Inkscape extension that allows you to create matplotlib visualizations and insert them seamlessly into your SVG documents. Perfect for scientific illustrations, data visualization in design projects, and publication-ready graphics.
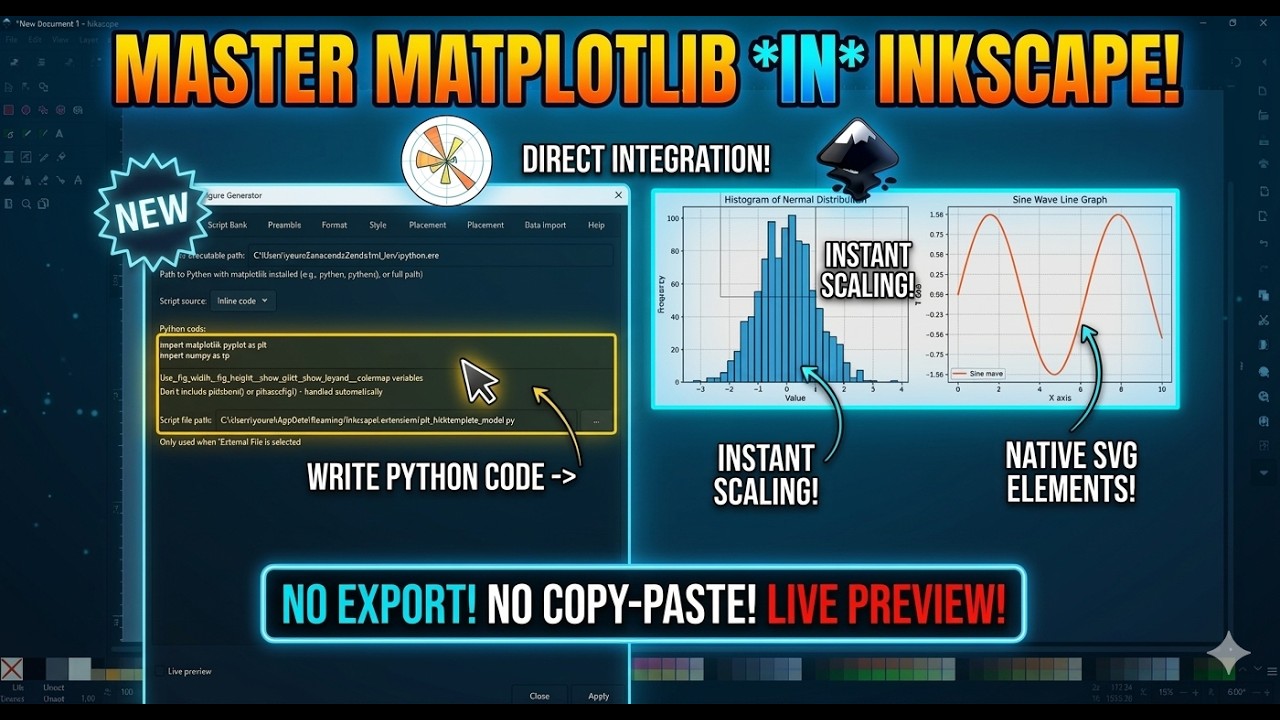
Click to watch the full tutorial on YouTube
- Features
- Installation
- Quick Start
- Usage Guide
- Dependencies
- Examples
- Troubleshooting
- Script Bank
- Contributing
-
📊 Multiple Script Sources
- Inline Code: Write matplotlib code directly in the extension dialog
- External File: Load scripts from
.pyfiles - Script Bank: Pre-built templates for common plot types
-
🎨 Flexible Output Formats
- SVG: Native vector graphics, fully editable in Inkscape
- PNG: High-resolution raster images
- PDF: Publication-quality vector output
-
📁 Data Import Support
- CSV, Excel, JSON, and text file formats
- Automatic column extraction
- Pandas DataFrame integration
-
🎯 Customizable Styling
- Built-in matplotlib styles (seaborn, ggplot, etc.)
- Font family and size controls
- Color map selection
- Grid and legend customization
-
📐 Smart Positioning
- Center, corners, or cursor-based placement
- Automatic size calculation based on DPI
- Preserve aspect ratio
Windows:
C:\Users\[YourUsername]\AppData\Roaming\inkscape\extensions\
macOS:
~/Library/Application Support/org.inkscape.Inkscape/config/inkscape/extensions/
Linux:
~/.config/inkscape/extensions/
-
Download/Clone the extension:
git clone https://github.com/YouvenZ/plt_ink.git
-
Copy to extensions directory:
# Windows (PowerShell)
Copy-Item -Recurse plt_ink [extensions-directory]\plt_ink

# macOS/Linux
cp -r plt_ink [extensions-directory]/plt_ink
-
Verify file structure:
plt_ink/ ├── plt_ink.py ├── plt_ink.inx └── plt_ink_scripts/ ├── line_plots/ ├── scatter_plots/ ├── bar_charts/ ├── statistical/ ├── scientific/ ├── time_series/ └── publication/ -
Restart Inkscape
Open Inkscape and check: Extensions → Render → Matplotlib Figure Generator
- Open your document in Inkscape
- Go to Extensions → Render → Matplotlib Figure Generator
- In the Script tab, select Inline Code as source
- Enter your matplotlib code:
import numpy as np
x = np.linspace(0, 10, 100)
y = np.sin(x)
plt.plot(x, y, label='sin(x)')
plt.xlabel('X axis')
plt.ylabel('Y axis')
plt.title('Simple Sine Wave')
if _show_legend:
    plt.legend(loc=_legend_position)
if _show_grid:
    plt.grid(True)
- Click Apply
Result: A matplotlib figure appears in your Inkscape document!
Click to expand
Write matplotlib code directly in the text area. The extension provides:
Pre-defined Variables:
_fig_width- Figure width from settings_fig_height- Figure height from settings_dpi- DPI setting_show_grid- Grid toggle_show_legend- Legend toggle_legend_position- Legend location_colormap- Selected colormap
Auto-imported Modules:
matplotlib.pyplot as pltnumpy as np
Example:
# Data
x = np.linspace(0, 2*np.pi, 100)
y1 = np.sin(x)
y2 = np.cos(x)

# Plot
plt.plot(x, y1, label='sin(x)', color='blue')
plt.plot(x, y2, label='cos(x)', color='red')

plt.title('Trigonometric Functions')
plt.xlabel('Radians')
plt.ylabel('Value')

if _show_legend:
    plt.legend(loc=_legend_position)
if _show_grid:
plt.grid(True, alpha=0.3)Click to expand
Load a Python script from your filesystem:
- Select External File as source
- Browse to your
.pyfile - Click Apply
File Requirements:
- Must use
pltfor plotting - Don't call
plt.show()(handled automatically) - Don't call
plt.savefig()(handled automatically)
Click to expand
Use pre-built templates from the script bank:
Available Categories:
| Category | Description |
|---|---|
line_plots |
Basic line and curve plots |
scatter_plots |
Scatter and bubble charts |
bar_charts |
Bar and histogram plots |
statistical |
Box plots, violin plots, etc. |
scientific |
Contour, vector fields, etc. |
time_series |
Time-based data visualization |
publication |
Publication-ready templates |
How to use:
- Select Script Bank as source
- Choose category
- Choose script
- Click Apply
| Parameter | Default | Range | Description |
|---|---|---|---|
| Output Format | SVG | SVG/PNG/PDF | Output file format |
| Figure Width | 8.0 | 1-20 | Width in inches |
| Figure Height | 6.0 | 1-20 | Height in inches |
| DPI | 96 | 72-600 | Resolution |
| Transparent | No | Yes/No | Transparent background |
| Tight Layout | Yes | Yes/No | Remove extra whitespace |
| Parameter | Default | Options | Description |
|---|---|---|---|
| Plot Style | default | default, seaborn, ggplot, etc. | Matplotlib style |
| Color Map | viridis | viridis, plasma, etc. | Default colormap |
| Show Grid | Yes | Yes/No | Enable grid |
| Show Legend | Yes | Yes/No | Enable legend |
| Legend Position | best | best, upper right, etc. | Legend location |
| Parameter | Default | Description |
|---|---|---|
| Position Mode | center | Where to place the figure |
| Embed Image | Yes | Embed as data URI vs. link |
Position Options:
center- Center of documenttop_left,top_center,top_rightbottom_left,bottom_center,bottom_rightcursor- At selected object position
| Parameter | Default | Description |
|---|---|---|
| Font Family | sans-serif | Plot font family |
| Font Size | 10 | Base font size |
| Line Width | 1.5 | Default line width |
| Marker Size | 6.0 | Default marker size |
| Use LaTeX | No | LaTeX text rendering |
| Save Script | No | Save generated script |
| Keep Temp Files | No | Don't delete temp files |
Click to expand
Import external data files for plotting:
Supported Formats:
| Format | Extension | Description |
|---|---|---|
| CSV | .csv | Comma-separated values |
| Excel | .xlsx, .xls | Excel spreadsheets |
| JSON | .json | JSON arrays/objects |
| Text | .txt, .dat | Space/tab-delimited |
Parameters:
- Data File Path: Path to your data file
- CSV Delimiter: Separator character (default:
,) - Skip Header: Skip first row
- X Column: Column index for X data
- Y Column: Column index for Y data
Available Variables (after import):
x_data- X column as numpy arrayy_data- Y column as numpy arraydataordf- Full DataFrame
Example with CSV:
# x_data and y_data are automatically loaded
plt.scatter(x_data, y_data, c='blue', alpha=0.6)
plt.xlabel('X Values')
plt.ylabel('Y Values')| Component | Version | Purpose |
|---|---|---|
| Inkscape | 1.0+ | Vector graphics editor |
| Python | 3.6+ | Extension runtime |
| matplotlib | 3.0+ | Plotting library |
| numpy | 1.15+ | Numerical computing |
Installation:
pip install matplotlib numpy| Component | Purpose | Installation |
|---|---|---|
| pandas | Data file import | pip install pandas |
| openpyxl | Excel file support | pip install openpyxl |
| LaTeX | LaTeX text rendering | Install TeX distribution |
Check Installation:
python -c "import matplotlib; print(matplotlib.__version__)"
python -c "import numpy; print(numpy.__version__)"Inline Code:
x = np.linspace(0, 10, 100)
y = np.sin(x) * np.exp(-x/10)

plt.plot(x, y, 'b-', linewidth=2, label='Damped sine')
plt.fill_between(x, y, alpha=0.3)
plt.xlabel('Time')
plt.ylabel('Amplitude')
plt.title('Damped Oscillation')
plt.legend()
plt.grid(True, alpha=0.3)fig, axes = plt.subplots(2, 2, figsize=(_fig_width, _fig_height))
x = np.linspace(0, 2*np.pi, 100)
axes[0,0].plot(x, np.sin(x))
axes[0,0].set_title('sin(x)')
axes[0,1].plot(x, np.cos(x))
axes[0,1].set_title('cos(x)')
axes[1,0].plot(x, np.tan(x))
axes[1,0].set_ylim(-5, 5)
axes[1,0].set_title('tan(x)')
axes[1,1].plot(x, np.sin(x)**2)
axes[1,1].set_title('sin²(x)')
for ax in axes.flat:
ax.grid(True, alpha=0.3)# Create meshgrid
x = np.linspace(-3, 3, 100)
y = np.linspace(-3, 3, 100)
X, Y = np.meshgrid(x, y)
Z = np.sin(X) * np.cos(Y)
# Contour plot
fig, ax = plt.subplots(figsize=(_fig_width, _fig_height))
contour = ax.contourf(X, Y, Z, levels=20, cmap=_colormap)
plt.colorbar(contour, label='Value')
ax.set_xlabel('X')
ax.set_ylabel('Y')
ax.set_title('Contour Plot')CSV file (data.csv):
time,temperature,humidity
0,20.5,65
1,21.2,63
2,22.1,60
3,23.5,58
4,24.0,55
Script:
# x_data and y_data loaded from columns 0 and 1
# df contains full DataFrame

fig, ax1 = plt.subplots()

ax1.plot(df.iloc[:,0], df.iloc[:,1], 'b-', label='Temperature')
ax1.set_xlabel('Time (hours)')
ax1.set_ylabel('Temperature (°C)', color='b')

ax2 = ax1.twinx()
ax2.plot(df.iloc[:,0], df.iloc[:,2], 'r--', label='Humidity')
ax2.set_ylabel('Humidity (%)', color='r')

plt.title('Temperature and Humidity Over Time')Extension not appearing in menu
Solutions:
- Check file locations match the expected structure
- Verify file permissions:
# Linux/macOS chmod +x plt_ink.py - Check Inkscape error console: View → Messages
- Restart Inkscape completely
- Verify Python path in extension settings
"Python not found" error
Solutions:
- In the extension dialog, set Python Path to your Python executable:
# Windows C:\Python39\python.exe # macOS/Linux /usr/bin/python3 - Check Python installation:
python --version
python3 --version
"Matplotlib not installed" error
Solutions:
- Install matplotlib for your Python version:
pip install matplotlib # or pip3 install matplotlib - Verify installation:
python -c "import matplotlib; print(matplotlib.__version__)" - Ensure you're using the same Python that Inkscape uses
Script execution fails
Debug Steps:
- Enable Keep Temp Files in Advanced tab
- Check the log file:
# Windows %TEMP%\matplotlib_inkscape_debug.log # macOS/Linux /tmp/matplotlib_inkscape_debug.log - Check the generated script in temp directory
- Run the script manually to see errors:
python /tmp/matplotlib_output_*.py
Figure not appearing or wrong size
Solutions:
- Check output format (SVG recommended for vector graphics)
- Verify figure dimensions aren't too large
- Check document units match expectations
- Try enabling Embed Image option
Check Log File: The extension writes detailed logs to:
[temp-directory]/matplotlib_inkscape_debug.log
Test Inline Code: Start with a minimal example:
plt.plot([1, 2, 3], [1, 4, 9])
plt.title('Test Plot')
Verify Script Generation:
- Enable Save Script option
- Set Script Save Path to a known location
- Examine the generated script for issues
basic_line.py- Simple line plotmulti_line.py- Multiple lines with legendstyled_line.py- Custom line styles
basic_scatter.py- Simple scatter plotbubble_chart.py- Size-coded scattercolored_scatter.py- Color-mapped scatter
basic_bar.py- Vertical bar charthorizontal_bar.py- Horizontal barsgrouped_bar.py- Grouped comparisonstacked_bar.py- Stacked bars
histogram.py- Histogram with densitybox_plot.py- Box and whiskerviolin_plot.py- Violin plot
contour.py- Contour plotheatmap.py- 2D heatmapvector_field.py- Quiver plot
time_plot.py- Time-indexed datafinancial.py- OHLC/candlestick
paper_figure.py- Journal-ready stylingsubplot_grid.py- Multi-panel figures
Add scripts to plt_ink_scripts/[category]/:
"""
My Custom Plot Template
Description of what this plot does
"""

import numpy as np
import matplotlib.pyplot as plt

# Use pre-defined variables
fig, ax = plt.subplots(figsize=(_fig_width, _fig_height))

# Your plotting code here
x = np.linspace(0, 10, 100)
y = np.sin(x)

ax.plot(x, y)
ax.set_title('My Custom Plot')

if _show_grid:
    ax.grid(True, alpha=0.3)
if _show_legend:
ax.legend(loc=_legend_position)plt_ink/
├── plt_ink.py # Main extension code
├── plt_ink.inx # Inkscape extension definition
├── README.md # This file
├── LICENSE # MIT License
└── plt_ink_scripts/ # Script bank directory
├── line_plots/
│ ├── basic_line.py
│ └── ...
├── scatter_plots/
├── bar_charts/
├── statistical/
├── scientific/
├── time_series/
└── publication/
Contributions welcome! Please:
- Fork the repository
- Create feature branch (
git checkout -b feature/amazing-feature) - Commit changes (
git commit -m 'Add amazing feature') - Push to branch (
git push origin feature/amazing-feature) - Open Pull Request
Adding Scripts to Bank:
- Create your script in the appropriate category folder
- Include docstring with description
- Use pre-defined variables (
_fig_width,_show_grid, etc.) - Test with the extension before submitting
Development Setup:
git clone https://github.com/YouvenZ/plt_ink.git
cd plt_ink
# Symlink to extensions directory for testing
# Windows (PowerShell as Admin)
New-Item -ItemType Junction -Path "$env:APPDATA\inkscape\extensions\plt_ink" -Target "$(Get-Location)"This project is licensed under the MIT License - see LICENSE file for details.
Copyright (c) 2026 Rachid, Youven ZEGHLACHE
- Issues: GitHub Issues
- Discussions: GitHub Discussions
- Email: youvenz.pro@gmail.com
- ✨ Initial release
- ✅ Inline code execution
- ✅ External file loading
- ✅ Script bank with templates
- ✅ SVG, PNG, PDF output formats
- ✅ Data import (CSV, Excel, JSON, Text)
- ✅ Multiple matplotlib styles
- ✅ Custom positioning options
- ✅ LaTeX support
- ✅ Comprehensive logging