Framework-agnostic observability for multi-step LLM pipelines.
TraceForge is a lightweight local prototype that instruments arbitrary Python functions, records nested execution traces, stores them in SQLite, and visualizes latency, token usage, cost, errors, and parent-child step relationships.
It is not intended to replace production platforms like LangSmith or Langfuse. The goal is to expose and implement the core mechanics behind LLM observability from scratch.
Tools like LangSmith and Langfuse are powerful production platforms, but they can hide some of the lower-level mechanics of tracing. TraceForge was built from scratch to make those mechanics explicit. TraceForge: two lines of instrumentation wrap any Python function, regardless of how it calls an LLM or what tools it uses. The tracing layer is just Python context managers and a SQLite database.
Building this from scratch was intentional. The interesting engineering is in the parts those tools hide: how do you track parent-child step relationships across arbitrary call stacks without asking the user to pass a context object everywhere? How do you design a schema that makes the five most common observability queries fast? What does a waterfall chart actually need from the data model to render correctly?
| Feature | Details |
|---|---|
| Instrumentation | trace_run context manager + trace_step context manager + @trace_step_decorator |
| Nesting | Automatic parent step ID tracking via thread-local stack - no context passing required |
| Storage | SQLite with 5 indexes, queryable by run ID, step name, time range, token count, error status |
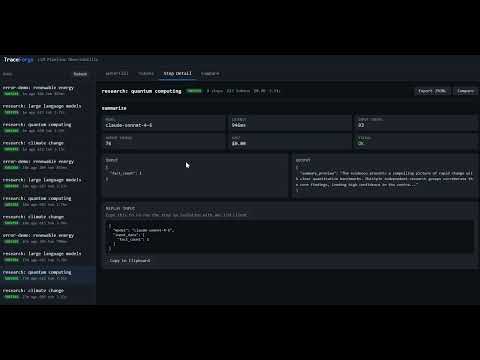
| Waterfall UI | Timeline view (browser DevTools Network-style), depth-indented nested steps, error highlighting |
| Token breakdown | Per-step input/output bar chart with cost attribution |
| Run comparison | Side-by-side diff of any two runs, latency and token deltas highlighted green/red |
| Replay | Reconstruct exact inputs for any step and re-run in isolation for debugging |
| Export | Traces as OpenTelemetry-style JSONL spans that can be adapted for external tracing systems. |
| REST API | FastAPI backend, fully documented at /docs |
| Zero framework deps | No LangChain, LlamaIndex, OpenAI SDK, or agent framework required |
TraceForge is functional as a local prototype. The demo script generates sample traces, and the tracing package demonstrates nested step tracking, SQLite persistence, replay inputs, and export utilities.
This repo is intended to show the core engineering mechanics behind LLM observability systems, not to provide a hosted production monitoring service.
Clone the repository:
git clone https://github.com/agentjakey/Trace-Forge.git
cd Trace-Forge
Create and activate a virtual environment:
python -m venv .venvOn macOS/Linux:
source .venv/bin/activateOn Windows PowerShell:
.venv\Scripts\Activate.ps1Install dependencies:
pip install -r requirements.txtGenerate sample traces:
python demo.pyStart the dashboard:
uvicorn server:app --reloadOR if that gives you any error:
python -m uvicorn server:app --reloadThen open the link given in your terminal.
The demo runs in mock mode by default, so no API key is required. To use real Claude API calls, set ANTHROPIC_API_KEY before running demo.py.
Wrap any LLM call or tool call with trace_step. It records start time, end time, model, tokens, cost, and parent step ID automatically.
import traceforge
from traceforge import trace_run, trace_step

traceforge.init("traceforge.db")

with trace_run("my pipeline", metadata={"version": "1.0"}) as run_id:

    # Tool call -- no LLM, no tokens
    with trace_step("web_search", input_data={"query": "climate change"}) as r:
        results = my_search_function("climate change")
        r["output"] = {"results": results, "count": len(results)}

    # LLM call with token + cost tracking
    with trace_step(
        "summarize",
        input_data={"result_count": len(results)},
        model="claude-sonnet-4-6",
        cost_per_input_token=3e-6,
        cost_per_output_token=1.5e-5,
    ) as r:
        response = call_llm(prompt, model="claude-sonnet-4-6")
        r["output"]        = response.content
        r["tokens_input"]  = response.usage.input_tokens
        r["tokens_output"] = response.usage.output_tokens
        r["model"]         = response.model

    # Nested steps -- parent_step_id is set automatically
    with trace_step("format_report", input_data={"draft_len": len(draft)}) as r:
        with trace_step("validate", input_data={"stage": "pre-format"}) as r2:
            r2["output"] = {"valid": True}
r["output"] = final_reportfrom traceforge import trace_step_decorator
@trace_step_decorator(model="claude-haiku-4-5-20251001", cost_per_input_token=3e-7)
def extract_facts(text: str) -> list:
return call_llm(text)storage = traceforge.get_storage()
# All steps with errors in the last hour
import time
steps = storage.query_steps(
start_time=time.time() - 3600,
has_error=True,
limit=50,
)
# Steps by name across all runs
steps = storage.query_steps(step_name="summarize", min_tokens=500)
# Full trace for a run
steps = storage.get_steps(run_id)from traceforge.replay import get_step_inputs, replay_step
# Inspect exactly what was sent to the model
inputs = get_step_inputs(storage, step_id)
print(inputs["input_data"]) # exact prompt/args recorded
print(inputs["original_output"]) # what the model returned
# Re-run with a different input
result = replay_step(
storage, step_id,
executor=my_llm_fn,
override_input={"query": "revised prompt"},
)from traceforge.export import export_run_jsonl
jsonl = export_run_jsonl(storage, run_id)
# Each line is an OTel-compatible span with traceId, spanId, parentSpanId,
# startTimeUnixNano, endTimeUnixNano, attributes (model, tokens, cost, latency)The FastAPI server exposes a complete REST interface. Interactive docs available at http://localhost:8000/docs.
| Method | Endpoint | Description |
|---|---|---|
GET |
/api/runs |
List all runs with aggregate token/cost totals |
GET |
/api/runs/{run_id} |
Run detail with step tree and root list |
GET |
/api/runs/{run_id}/export |
Download JSONL (OTel spans) |
GET |
/api/steps/{step_id} |
Single step detail |
GET |
/api/steps/{step_id}/inputs |
Reconstruct replay inputs |
GET |
/api/search |
Query steps: ?run_id=&step_name=&has_error=&min_tokens=&limit= |
GET |
/api/compare |
Side-by-side diff: ?run_id_a=&run_id_b= |
POST |
/api/replay |
Return inputs needed to re-run a step (body: {step_id, override_input}) |
traceforge/
  tracer.py     Context managers + decorator. Thread-local stack tracks the
                current step chain so nested trace_step calls automatically
                receive the correct parent_step_id without the user passing
                any context. Errors are caught, recorded, and re-raised.

  storage.py    SQLite via the stdlib sqlite3 module. Thread-local connections
                avoid sharing state across threads. Schema has 5 indexes
                chosen for the five most common observability queries.

  export.py     Converts Step dicts to OpenTelemetry span format. UUID-derived
                traceId/spanId/parentSpanId preserve the tree structure.

  replay.py     Fetches recorded input_data for any step. Supports optional
                input override for "what if" debugging.

  models.py     Step and Run dataclasses. Pure data, no logic.

server.py       FastAPI app. Tree reconstruction happens at query time by
                walking parent_step_id references. Comparison aligns steps
                by name across two runs.

static/
  index.html    Dark terminal UI: sidebar run list, four tab views.
  app.js        ~490 lines of vanilla JS. Waterfall bars are CSS-positioned
                divs with percentage widths derived from wall-clock offsets.
                No framework, no bundler, no build step.

demo.py         Research agent: web_search x3 -> extract_facts ->
                summarize (nested draft + refine) -> fact_check ->
                format_report. Includes an error-demo run. Runs in mock
                mode without an API key.
CREATE TABLE runs (
    run_id     TEXT PRIMARY KEY,
    run_name   TEXT NOT NULL,
    started_at REAL NOT NULL,
    ended_at   REAL,
    status     TEXT NOT NULL DEFAULT 'running',  -- running | success | error
    metadata   TEXT NOT NULL DEFAULT '{}'         -- arbitrary JSON
);

CREATE TABLE steps (
    step_id        TEXT PRIMARY KEY,
    run_id         TEXT NOT NULL REFERENCES runs,
    parent_step_id TEXT,           -- NULL for root steps
    step_name      TEXT NOT NULL,
    model          TEXT,           -- NULL for non-LLM tool calls
    input_data     TEXT NOT NULL,  -- JSON
    output_data    TEXT,           -- JSON, NULL until step completes
    tokens_input   INTEGER NOT NULL DEFAULT 0,
    tokens_output  INTEGER NOT NULL DEFAULT 0,
    cost_usd       REAL NOT NULL DEFAULT 0.0,
    latency_ms     REAL NOT NULL DEFAULT 0.0,
    started_at     REAL NOT NULL,
    ended_at       REAL,
    error          TEXT            -- NULL on success, error string on failure
);

-- Indexes chosen for the five most common observability query patterns
CREATE INDEX idx_steps_run_id  ON steps(run_id);
CREATE INDEX idx_steps_parent  ON steps(parent_step_id);
CREATE INDEX idx_steps_name    ON steps(step_name);
CREATE INDEX idx_steps_started ON steps(started_at);
CREATE INDEX idx_runs_started ON runs(started_at);The core design challenge: if a user writes nested with trace_step(...) blocks, each inner step needs to know its parent without the user threading a context object through their code.
The solution is a per-thread stack in threading.local:
trace_run("pipeline")            # sets run_id on thread-local
  trace_step("summarize")        # pushes step A  |  parent = None
    trace_step("draft")          # pushes step B  |  parent = A
    trace_step("refine")         # pushes step C  |  parent = A
  trace_step("fact_check")       # pushes step D  |  parent = None
Each trace_step reads the top of the stack as its parent, then pushes its own ID. On exit (success or error) it pops itself. The stack is thread-local, so concurrent pipelines running in different threads never interfere with each other.
demo.py runs a research agent that produces a realistic step tree with mixed models and visible nesting:
research: climate change
  web_search          query: "climate change"
  web_search          query: "climate change recent data"
  web_search          query: "climate change future outlook"
  extract_facts       claude-haiku-4-5  |  ~112 tok in  ~48 tok out
  summarize           claude-sonnet-4-6 |  (parent of the next two steps)
    draft_summary     claude-sonnet-4-6 |  ~89 tok in   ~95 tok out
    refine_summary    claude-sonnet-4-6 |  ~106 tok in  ~88 tok out
  fact_check          claude-sonnet-4-6 |  ~78 tok in   ~42 tok out
  format_report       claude-haiku-4-5  |  ~134 tok in  ~118 tok out
Also generates an error-demo run with a mid-pipeline failure and fallback step, so error traces and recovery paths are visible in the UI.
Each step is exported as one JSONL line in OTel span format:
{
  "traceId": "44643ab86e5f4b4497b16b1d63aae594",
  "spanId": "a1b2c3d4e5f60001",
  "parentSpanId": "f0e1d2c3b4a50001",
  "operationName": "summarize",
  "startTimeUnixNano": "1714000000123456789",
  "endTimeUnixNano":   "1714000001456789012",
  "attributes": [
    {"key": "llm.model",             "value": {"stringValue": "claude-sonnet-4-6"}},
    {"key": "llm.tokens.input",      "value": {"intValue": "89"}},
    {"key": "llm.tokens.output",     "value": {"intValue": "95"}},
    {"key": "llm.cost_usd",          "value": {"doubleValue": 0.000169}},
    {"key": "traceforge.step_name",  "value": {"stringValue": "summarize"}},
    {"key": "traceforge.latency_ms", "value": {"doubleValue": 1333.2}}
  ],
  "status": {"code": "STATUS_CODE_OK"}
}
The export uses an OpenTelemetry-style span representation that can be adapted for external tracing systems.
Python 3.10+
fastapi >= 0.111.0
uvicorn[standard] >= 0.29.0
pydantic >= 2.0.0

# Optional -- only needed for real LLM calls in demo.py:
anthropic >= 0.28.0
The core tracing library (traceforge/) uses only the Python standard library.
| Metric | Value |
|---|---|
| Total lines of code | 1,690 |
| External dependencies (core library) | 0 |
| External dependencies (server + UI) | 3 |
| Database | SQLite (stdlib sqlite3) |
| Frontend framework | None |
| Agent framework required | None |
System design: The schema, indexes, and query API are shaped around actual observability access patterns rather than a generic data model. The thread-local stack for parent ID tracking solves a real ergonomics problem in a way that is completely invisible to the user.
LLMOps domain knowledge: Understanding what data to capture requires knowing what questions engineers ask when debugging a multi-step pipeline: tokens split by direction (not just total), cost as a first-class field, wall-clock offsets for waterfall rendering, parent step ID for tree reconstruction, and per-step error strings that propagate without silently swallowing exceptions.
Full-stack implementation: REST API design, SQL schema design, data visualization (waterfall chart in ~50 lines of vanilla JS using CSS percentage widths derived from timestamps), and a clean Python library API -- all in one coherent codebase under 2000 lines.
Production habits: Thread-safe SQLite connections via threading.local, proper error propagation (caught, recorded, re-raised - never swallowed), parameterized queries throughout, zero global mutable state outside the explicitly scoped thread-local.
TraceForge is a local-first prototype, not a production observability platform.
Current limitations:
- Traces are stored locally in SQLite, so this is best suited for local development, debugging, demos, and small experiments rather than high-volume production workloads.
- The project does not currently include authentication, authorization, user management, or hosted deployment configuration.
- The dashboard is intentionally lightweight and uses vanilla JavaScript rather than a production frontend framework.
- Token counts and costs are user-provided or demo-generated; TraceForge does not automatically calculate usage from every LLM provider SDK.
- OpenTelemetry export is formatted to resemble span-style JSONL output, but this project does not currently run a full OTel collector pipeline by default.
- Replay reconstructs recorded step inputs, but deterministic replay still depends on the user-provided executor, model settings, API behavior, and external tool state.
- The project currently focuses on observability mechanics rather than enterprise features such as persistence across teams, hosted dashboards, alerting, or distributed tracing across services.