

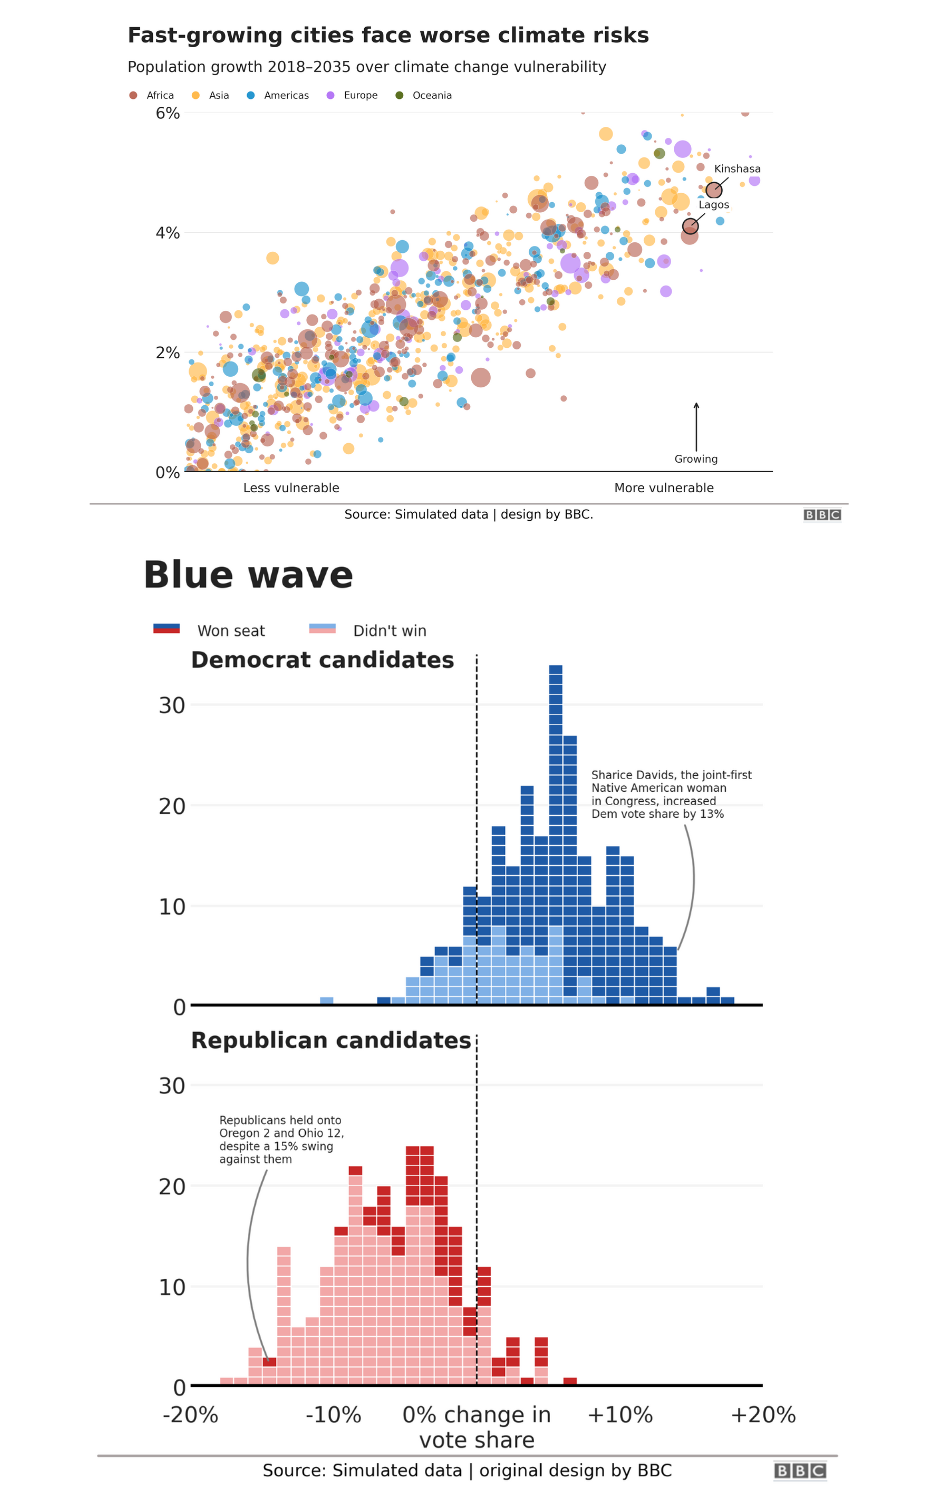
bbcstyle is a lightweight Python package that applies a BBC News-inspired visual theme to Matplotlib and Seaborn plots. It helps you create clean, publication-ready charts with consistent typography, minimalist gridlines, and optional source annotations or logos. Inspired by the R package bbplot but tailored for Python, this theme is ideal for reports, dashboards, and data journalism.
pip install bbcstyleCall the theme hook once at the start of your script/notebook:
import bbcstyle as bbc

bbc.set_theme()After you build your Matplotlib figure, call finalise_pot to add the BBC-style framing (title, subtitle, divider abot the source, and optional logo) and to save it if you provide a path.
import matplotlib.pyplot as plt
import numpy as np
import bbcstyle as bbc
from bbcstyle import finalise_plot
bbc.set_theme()
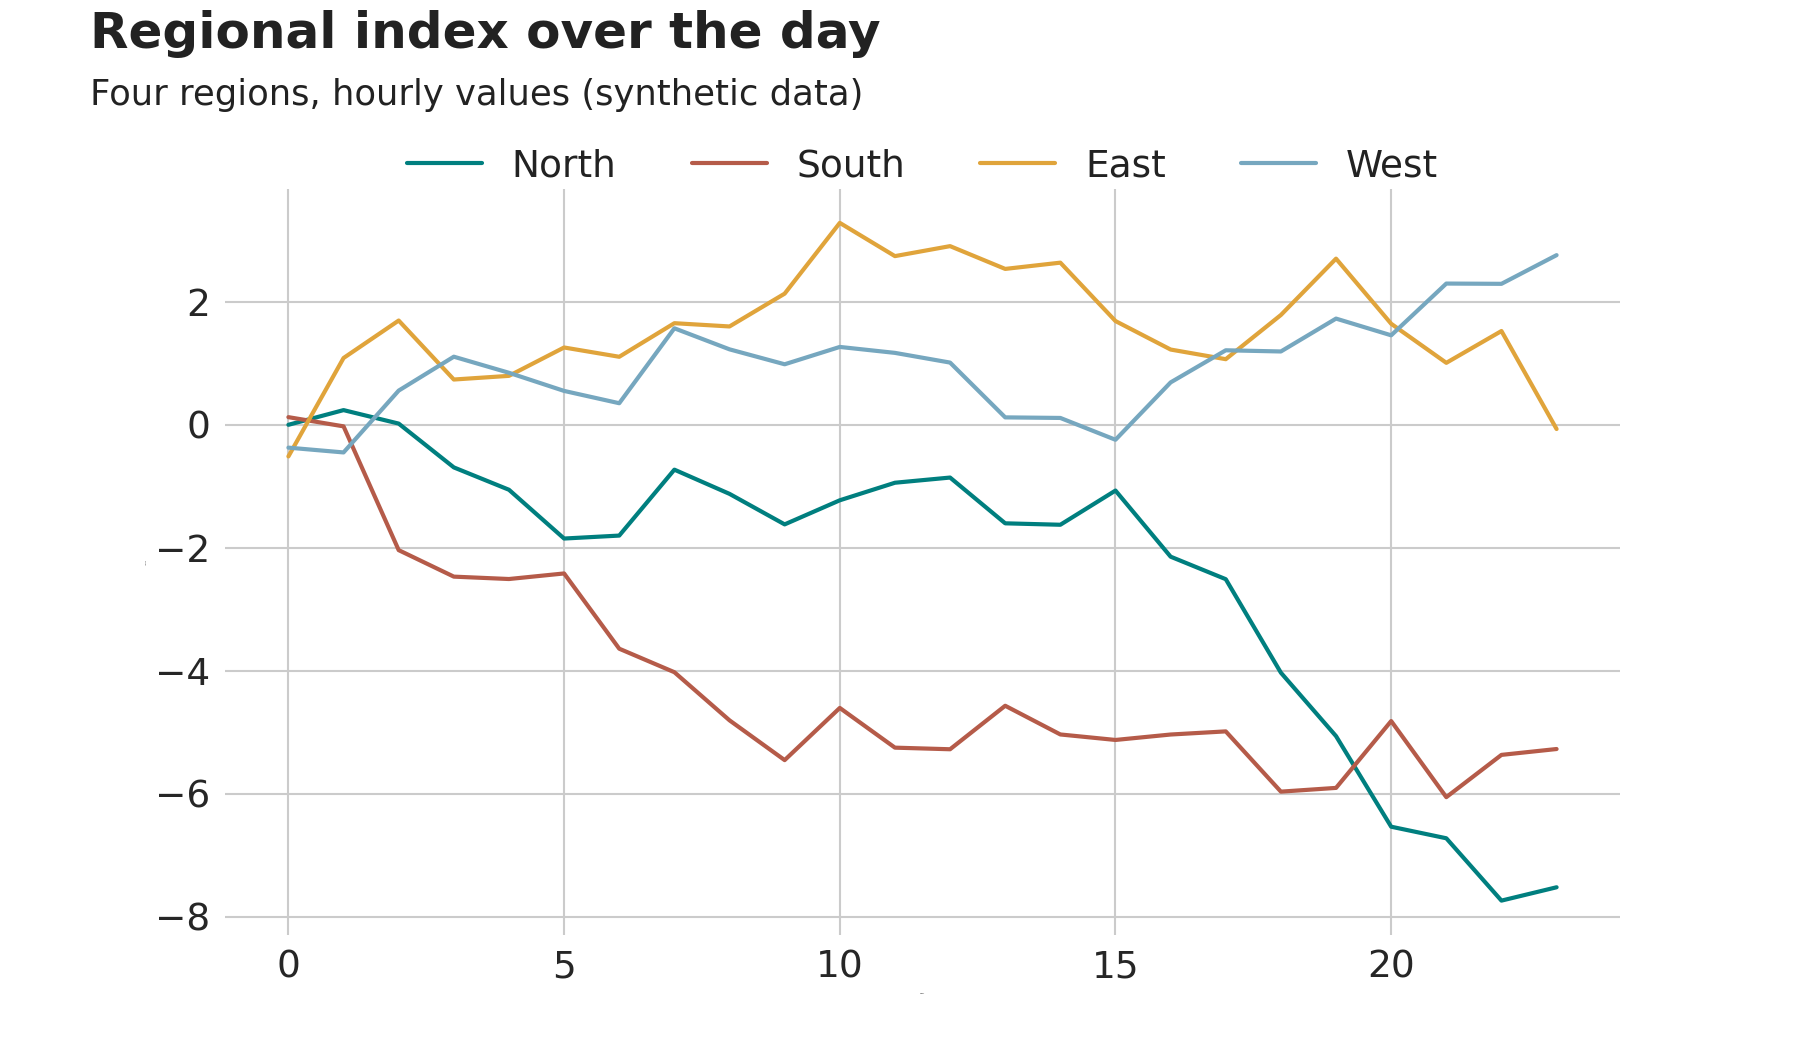
x = np.arange(0, 24)
fig, ax = plt.subplots(figsize=(9, 5), dpi=150)
ax.plot(x, np.cumsum(np.random.normal(0, 0.8, size=x.size)), linewidth=2, label="North")
ax.plot(x, np.cumsum(np.random.normal(0, 0.8, size=x.size)), linewidth=2, label="South")
ax.plot(x, np.cumsum(np.random.normal(0, 0.8, size=x.size)), linewidth=2, label="East")
ax.plot(x, np.cumsum(np.random.normal(0, 0.8, size=x.size)), linewidth=2, label="West")
ax.legend(frameon=False, ncols=2)
ax.spines[["top", "right"]].set_visible(False)
ax.set_xlabel("Hour")
ax.set_ylabel("Index")
finalise_plot(
fig=fig,
title="Regional index over the day",
subtitle="Synthetic data, 24 hours",
source="Source: Example data",
logo_path=None, # e.g. "assets/bbc_logo.png"
output_path="out/line_chart.png", # omit to skip saving
dpi=300,
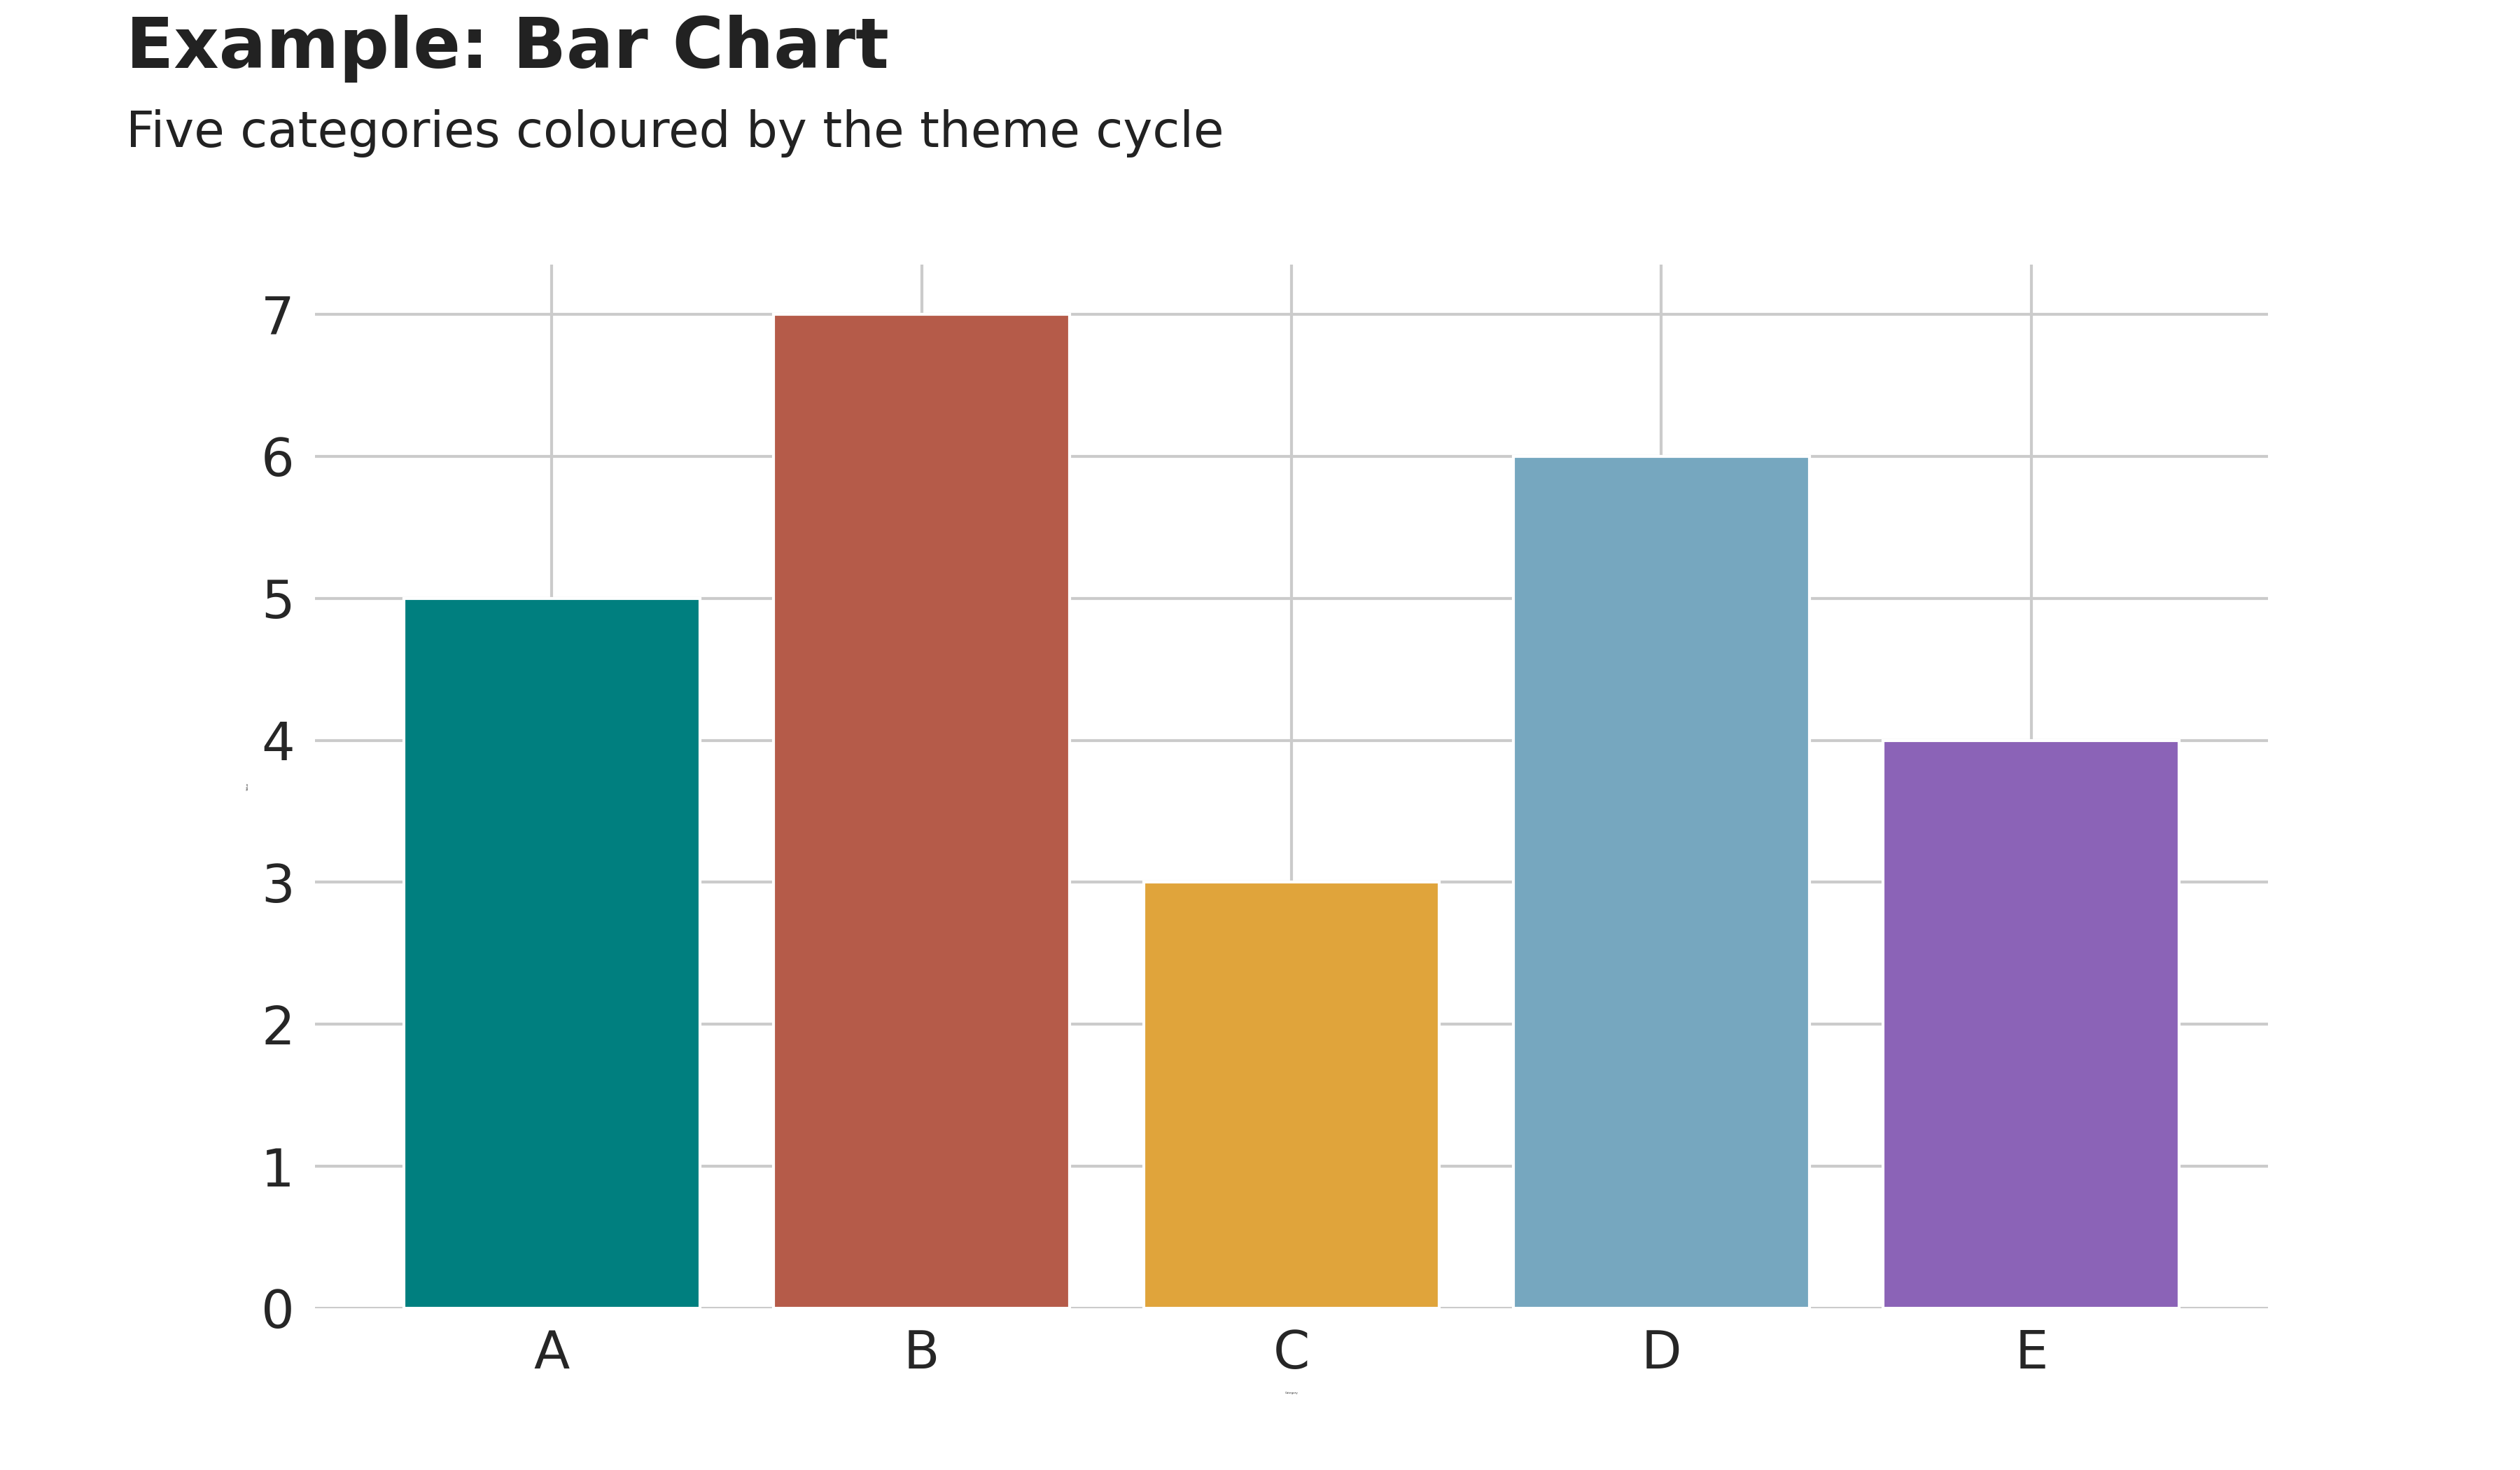
)The theme defines the color cycle in axes.prop_cycle. Use it directly so bars follow the theme palette.
import matplotlib.pyplot as plt
import bbcstyle as bbc
from bbcstyle import finalise_plot

bbc.set_theme()

cats = ["A", "B", "C", "D", "E"]
vals = [5, 7, 3, 6, 4]

# Pull colors from the active theme cycle
colors = plt.rcParams["axes.prop_cycle"].by_key()["color"]

fig, ax = plt.subplots(figsize=(8, 5), dpi=150)
ax.bar(cats, vals, color=colors[: len(cats)])

ax.spines[["top", "right"]].set_visible(False)
ax.set_xlabel("Category")
ax.set_ylabel("Value")

finalise_plot(
    fig=fig,
    title="Example: Bar Chart",
    subtitle="Five categories coloured by the theme",
    source="Source: Example data",
    logo_path=None,
    output_path="out/bar_chart.png",
    dpi=300,
)-
Call
bbc.set_theme()before creating figures so rcParams apply to everything you draw. -
finalise_plot:
- Keeps your figure size unless you pass
enforce_size=True. - Places a divider a fixed distance (in points) above the source line.
- If
logo_pathandsourceare provided, the logo is anchored bottom-right, aligned to the source baseline.
- Keeps your figure size unless you pass
-
Avoid
plt.tight_layout()afterfinalise_plot; the finaliser manages margins for title/subtitle/source.
examples/gallery/01_bar_chart.py
examples/gallery/02_line_chart.py
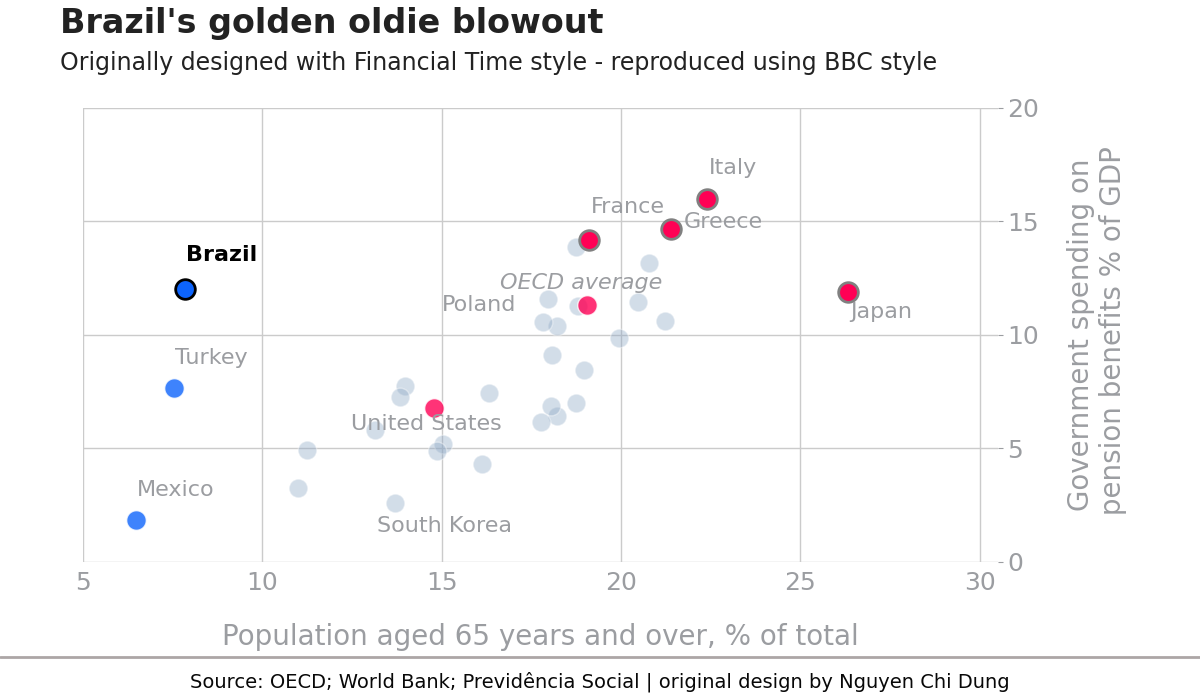
examples/gallery/03_scatter_plot.py
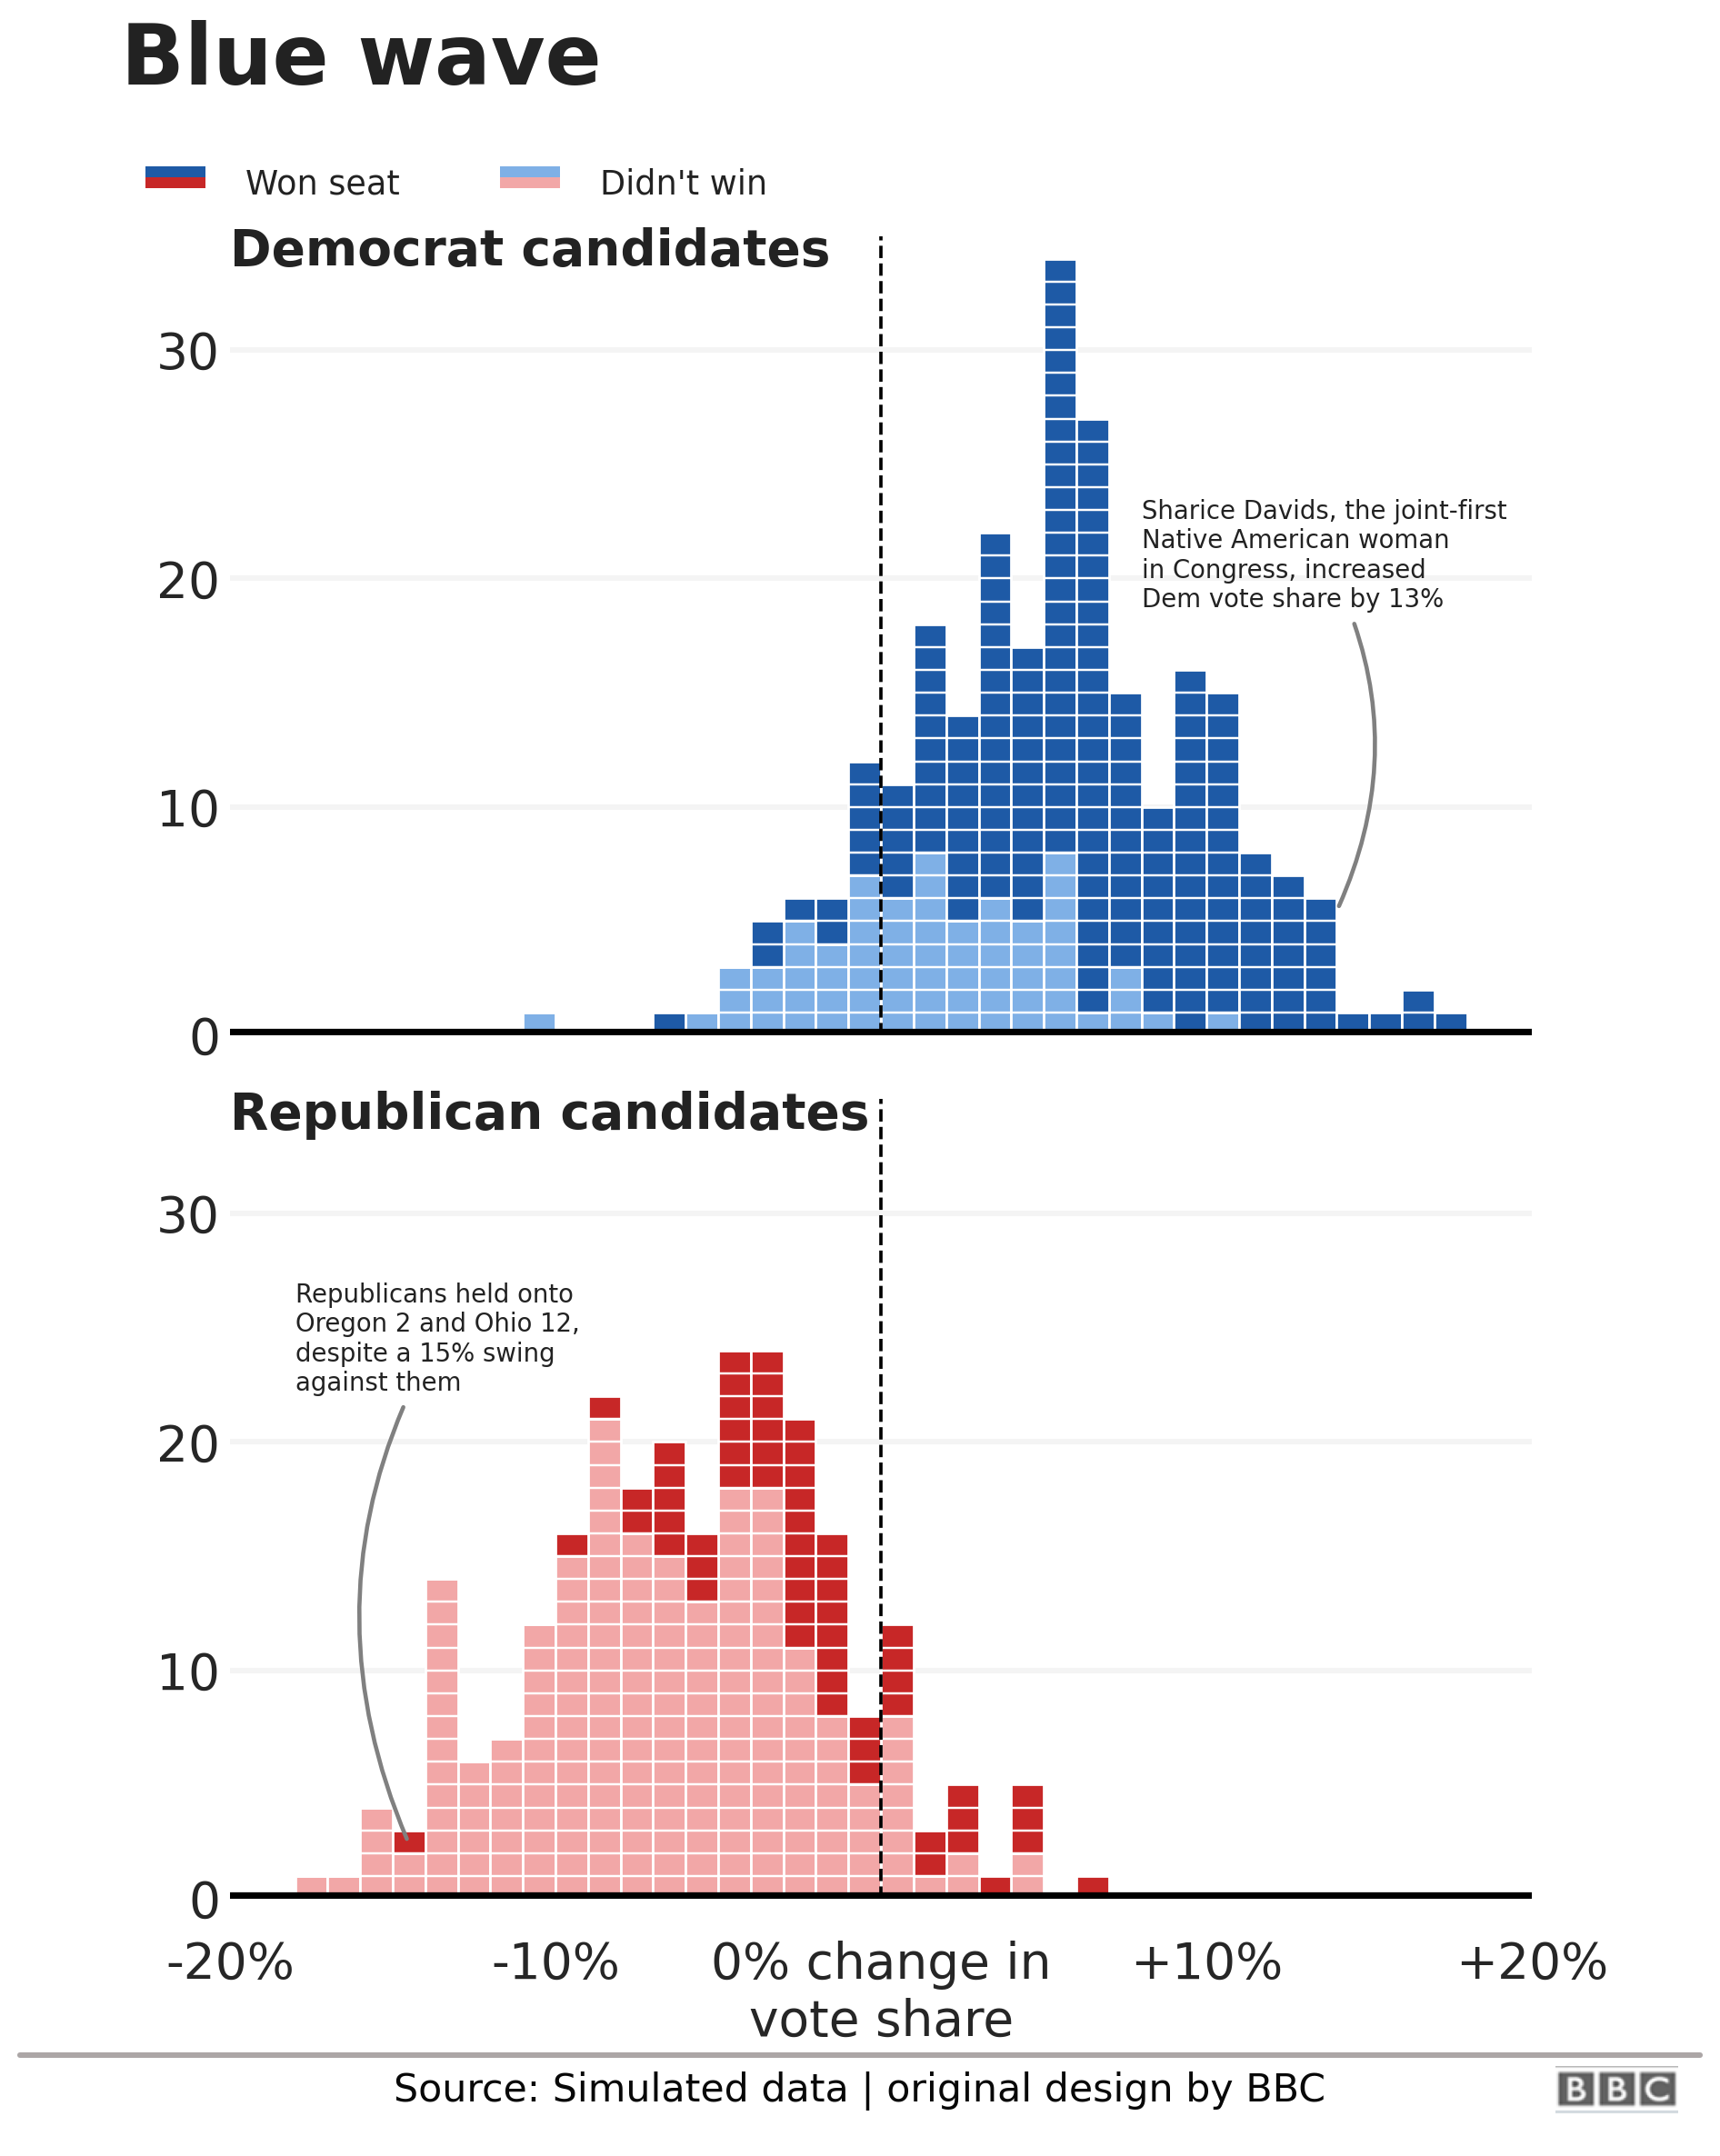
examples/gallery/04_histograms.py
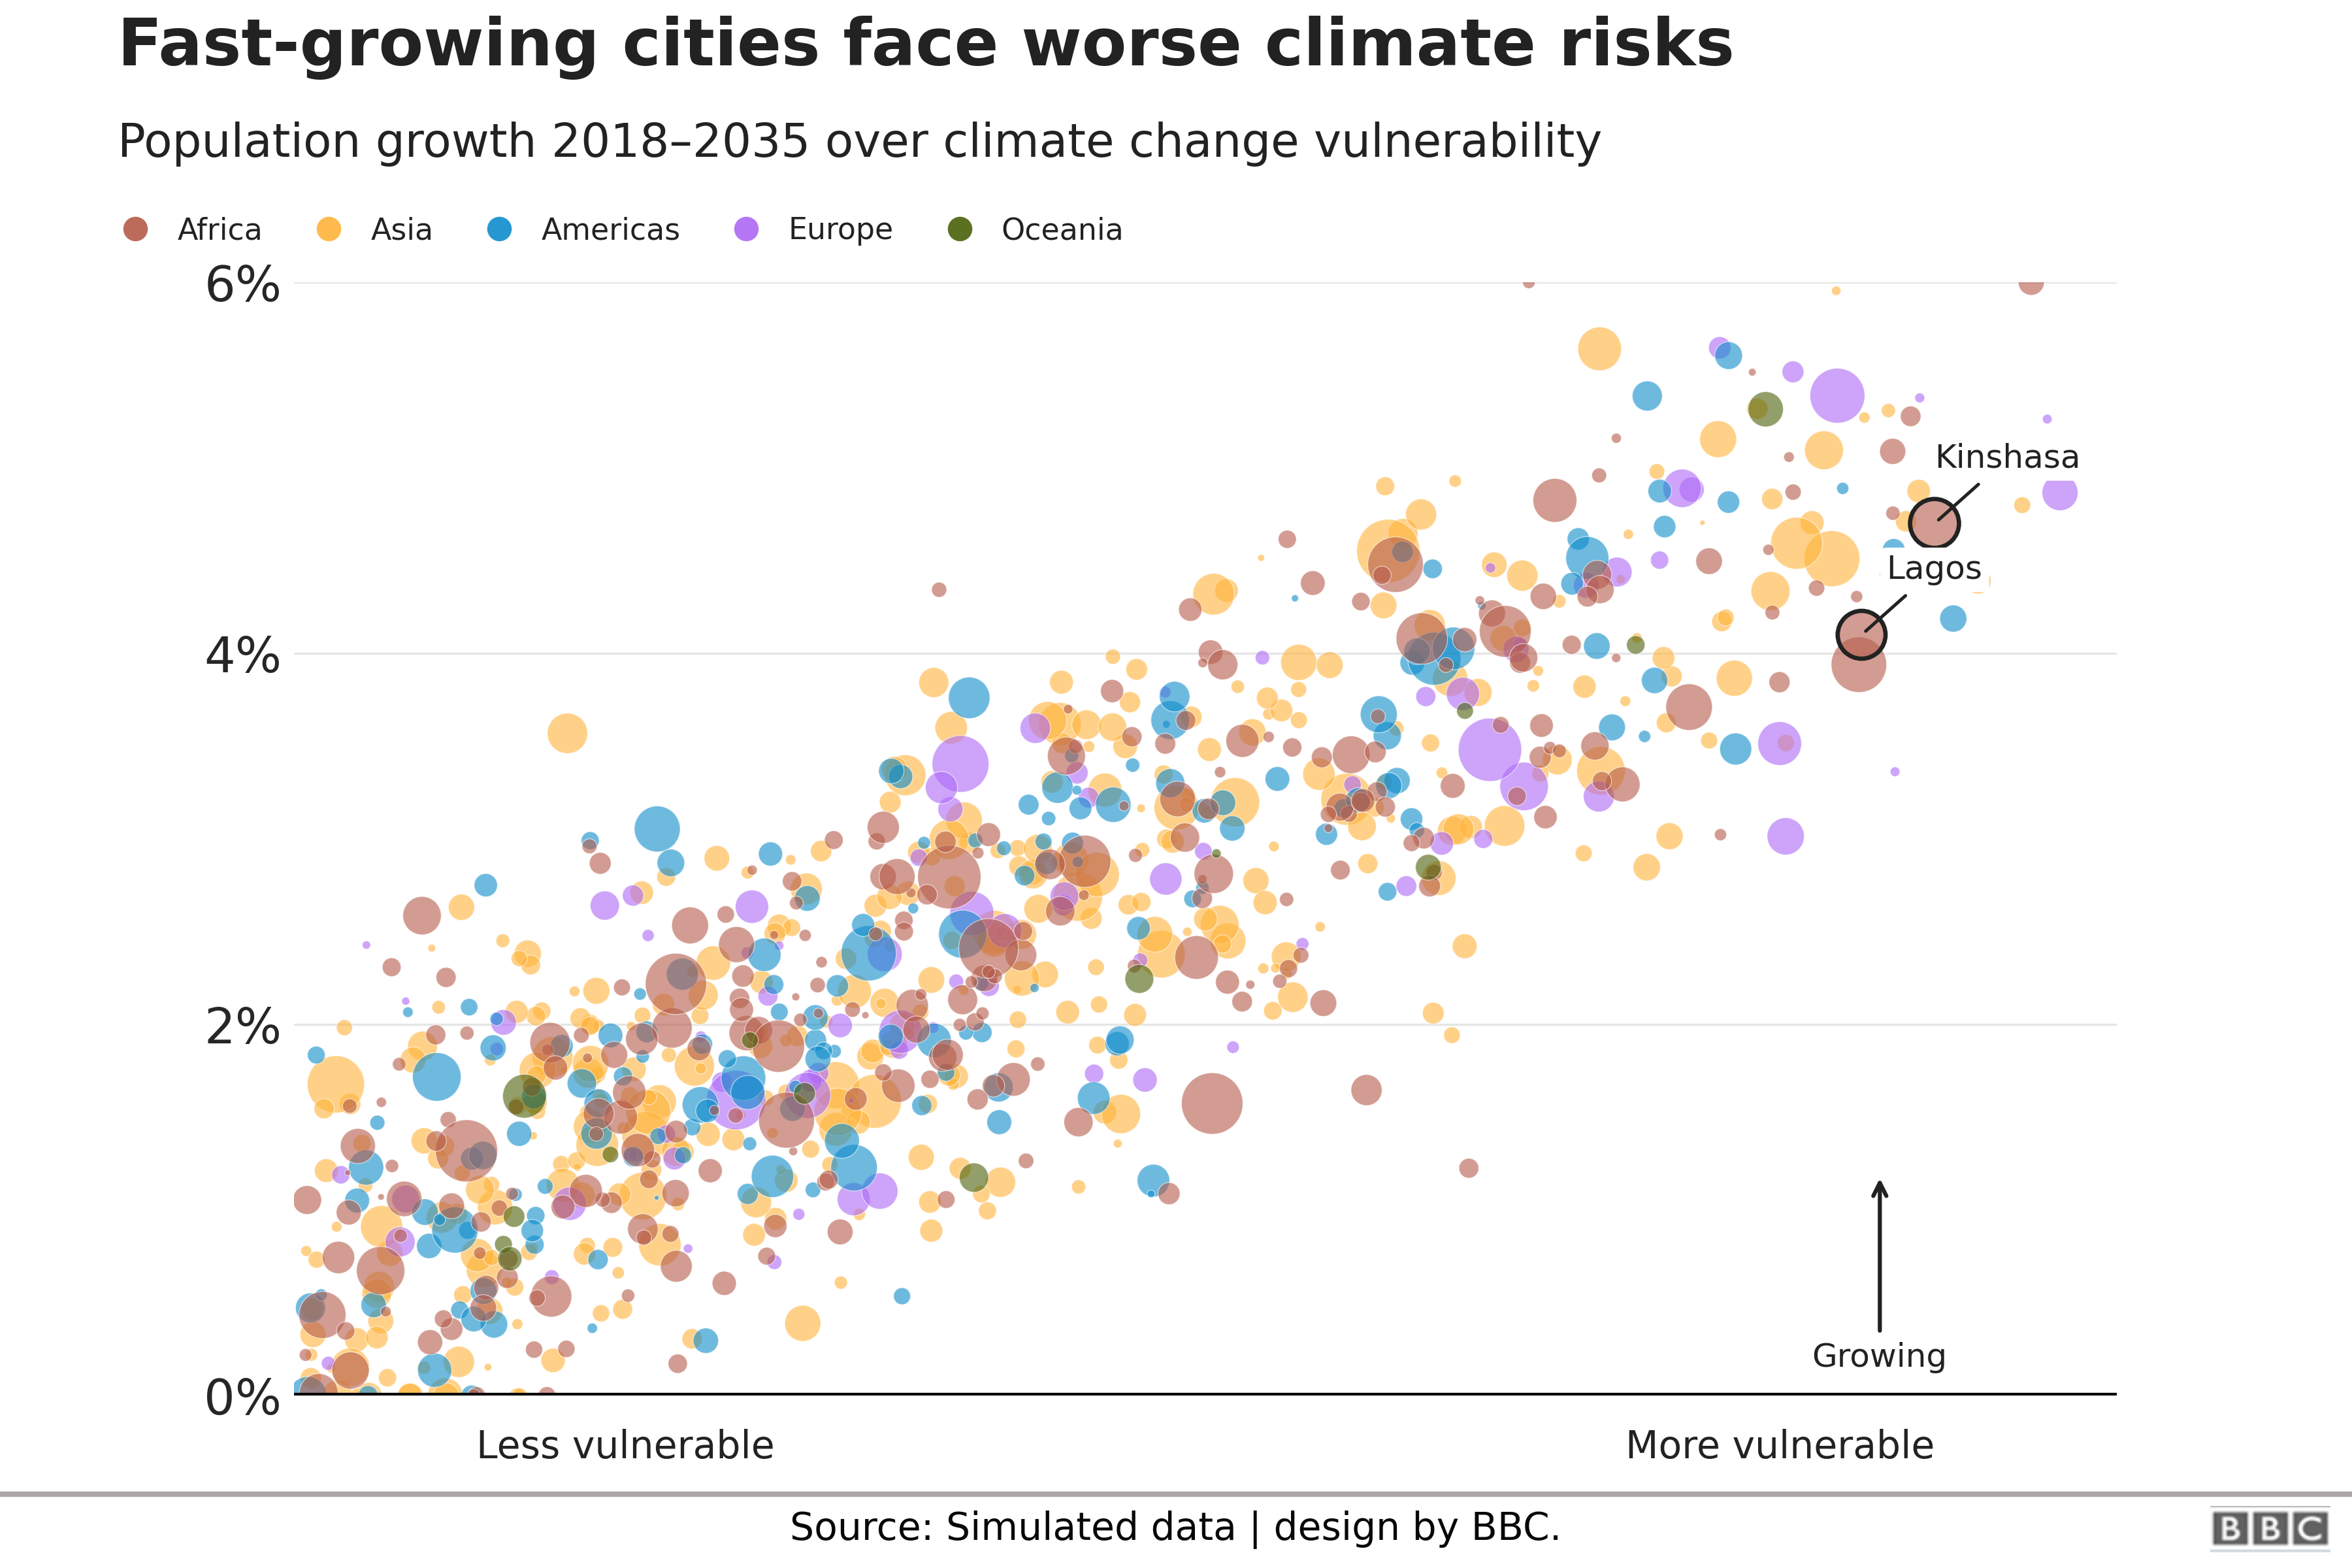
examples/gallery/05_bubble_scatter.py
Run them to generate PNGs in examples/gallery/out/.
This project is licensed under the MIT License. See LICENSE for details.
Note: “BBC” is a trademark of the British Broadcasting Corporation. This project is not affiliated with, endorsed by, or sponsored by the BBC. “BBC-inspired” refers to the general look & feel of certain public graphics.
Found a bug or have a feature request? Please open an issue and include:
- a minimal code snippet that reproduces the problem
- your Python, Matplotlib, and Seaborn versions, plus OS
- what you expected vs what you observed, and any screenshots
See bug report and feature request for details.
Contributions are welcome! A good first PR is often:
- a small fix to styling defaults,
- an additional gallery example in
examples/gallery/, - or a doc improvement.
See contributing for details.
python -m venv .venv && source .venv/bin/activate
python -m pip install -U pip
python -m pip install -e .
python -m pip install -U pytest ruff pre-commit
pre-commit install
pytest -qOpen an issue before large changes. Keep examples pure-Python (no notebooks) and save images to examples/gallery/out/. Run ruff and the pre-commit hooks; keep PRs focused and small. Add or update a test when changing behavior. See contributing for details.
We follow the Contributor Covenant. By participating, you agree to uphold this standard.
Created and maintained by Alessandro Tomassini (@ale-tom). Thanks to contributors and the broader visualization community for inspiration. Any similarities to BBC graphics are purely stylistic; this project is independent of the BBC.
If this package helps your work, please cite it:
@software{bbcstyle,
  title   = {bbcstyle: BBC-inspired theme for Matplotlib/Seaborn},
  author  = {Alessandro Tomassini},
  year    = {2025},
  version = {0.1.0},
  url     = {https://github.com/ale-tom/bbcstyle}
}