The dataset titled "Crimes - 2001 to Present" is a comprehensive collection of crime-related information in the city of Chicago, Illinois, spanning from the year 2001 to the present. This dataset is publicly available and maintained by the City of Chicago through its data portal, providing valuable insights into the city's public safety and law enforcement activities. In this dataset, one can find a wealth of information related to criminal incidents, including details about the type of crime, location, date, time, and other relevant attributes. The dataset contains a plethora of data fields, allowing for a detailed analysis of crime trends and patterns in Chicago. Some of the key data fields included in the dataset are:
-
ID: A unique identifier for each reported crime incident.
-
Case Number: A unique identifier assigned to each reported case.
-
Date: The date when the crime incident occurred.
-
Block: The block-level address where the crime took place.
-
IUCR: The Illinois Uniform Crime Reporting code, a numerical code representing the crime type.
-
Primary Type: The primary category of the crime (e.g., theft, assault, burglary).
-
Description: A brief description of the crime.
-
Location Description: The type of location where the crime occurred (e.g., street, residence, park).
-
Arrest: Indicates whether an arrest was made in connection with the crime.
-
Domestic: Specifies if the crime is considered domestic in nature.
-
Beat: A specific geographical area designated for police patrol.
-
District: The police district where the incident was reported.
-
Ward: The ward of the city where the incident occurred.
-
Community Area: The community area in Chicago where the incident took place.
-
FBI Code: The numerical code assigned by the FBI to categorize the crime.
-
X Coordinate and Y Coordinate: Geographic coordinates of the crime location.
-
Year and Month: Additional temporal information for analysis.
This dataset serves as a valuable resource for a wide range of stakeholders, including law enforcement agencies, researchers, policymakers, journalists, and the general public.
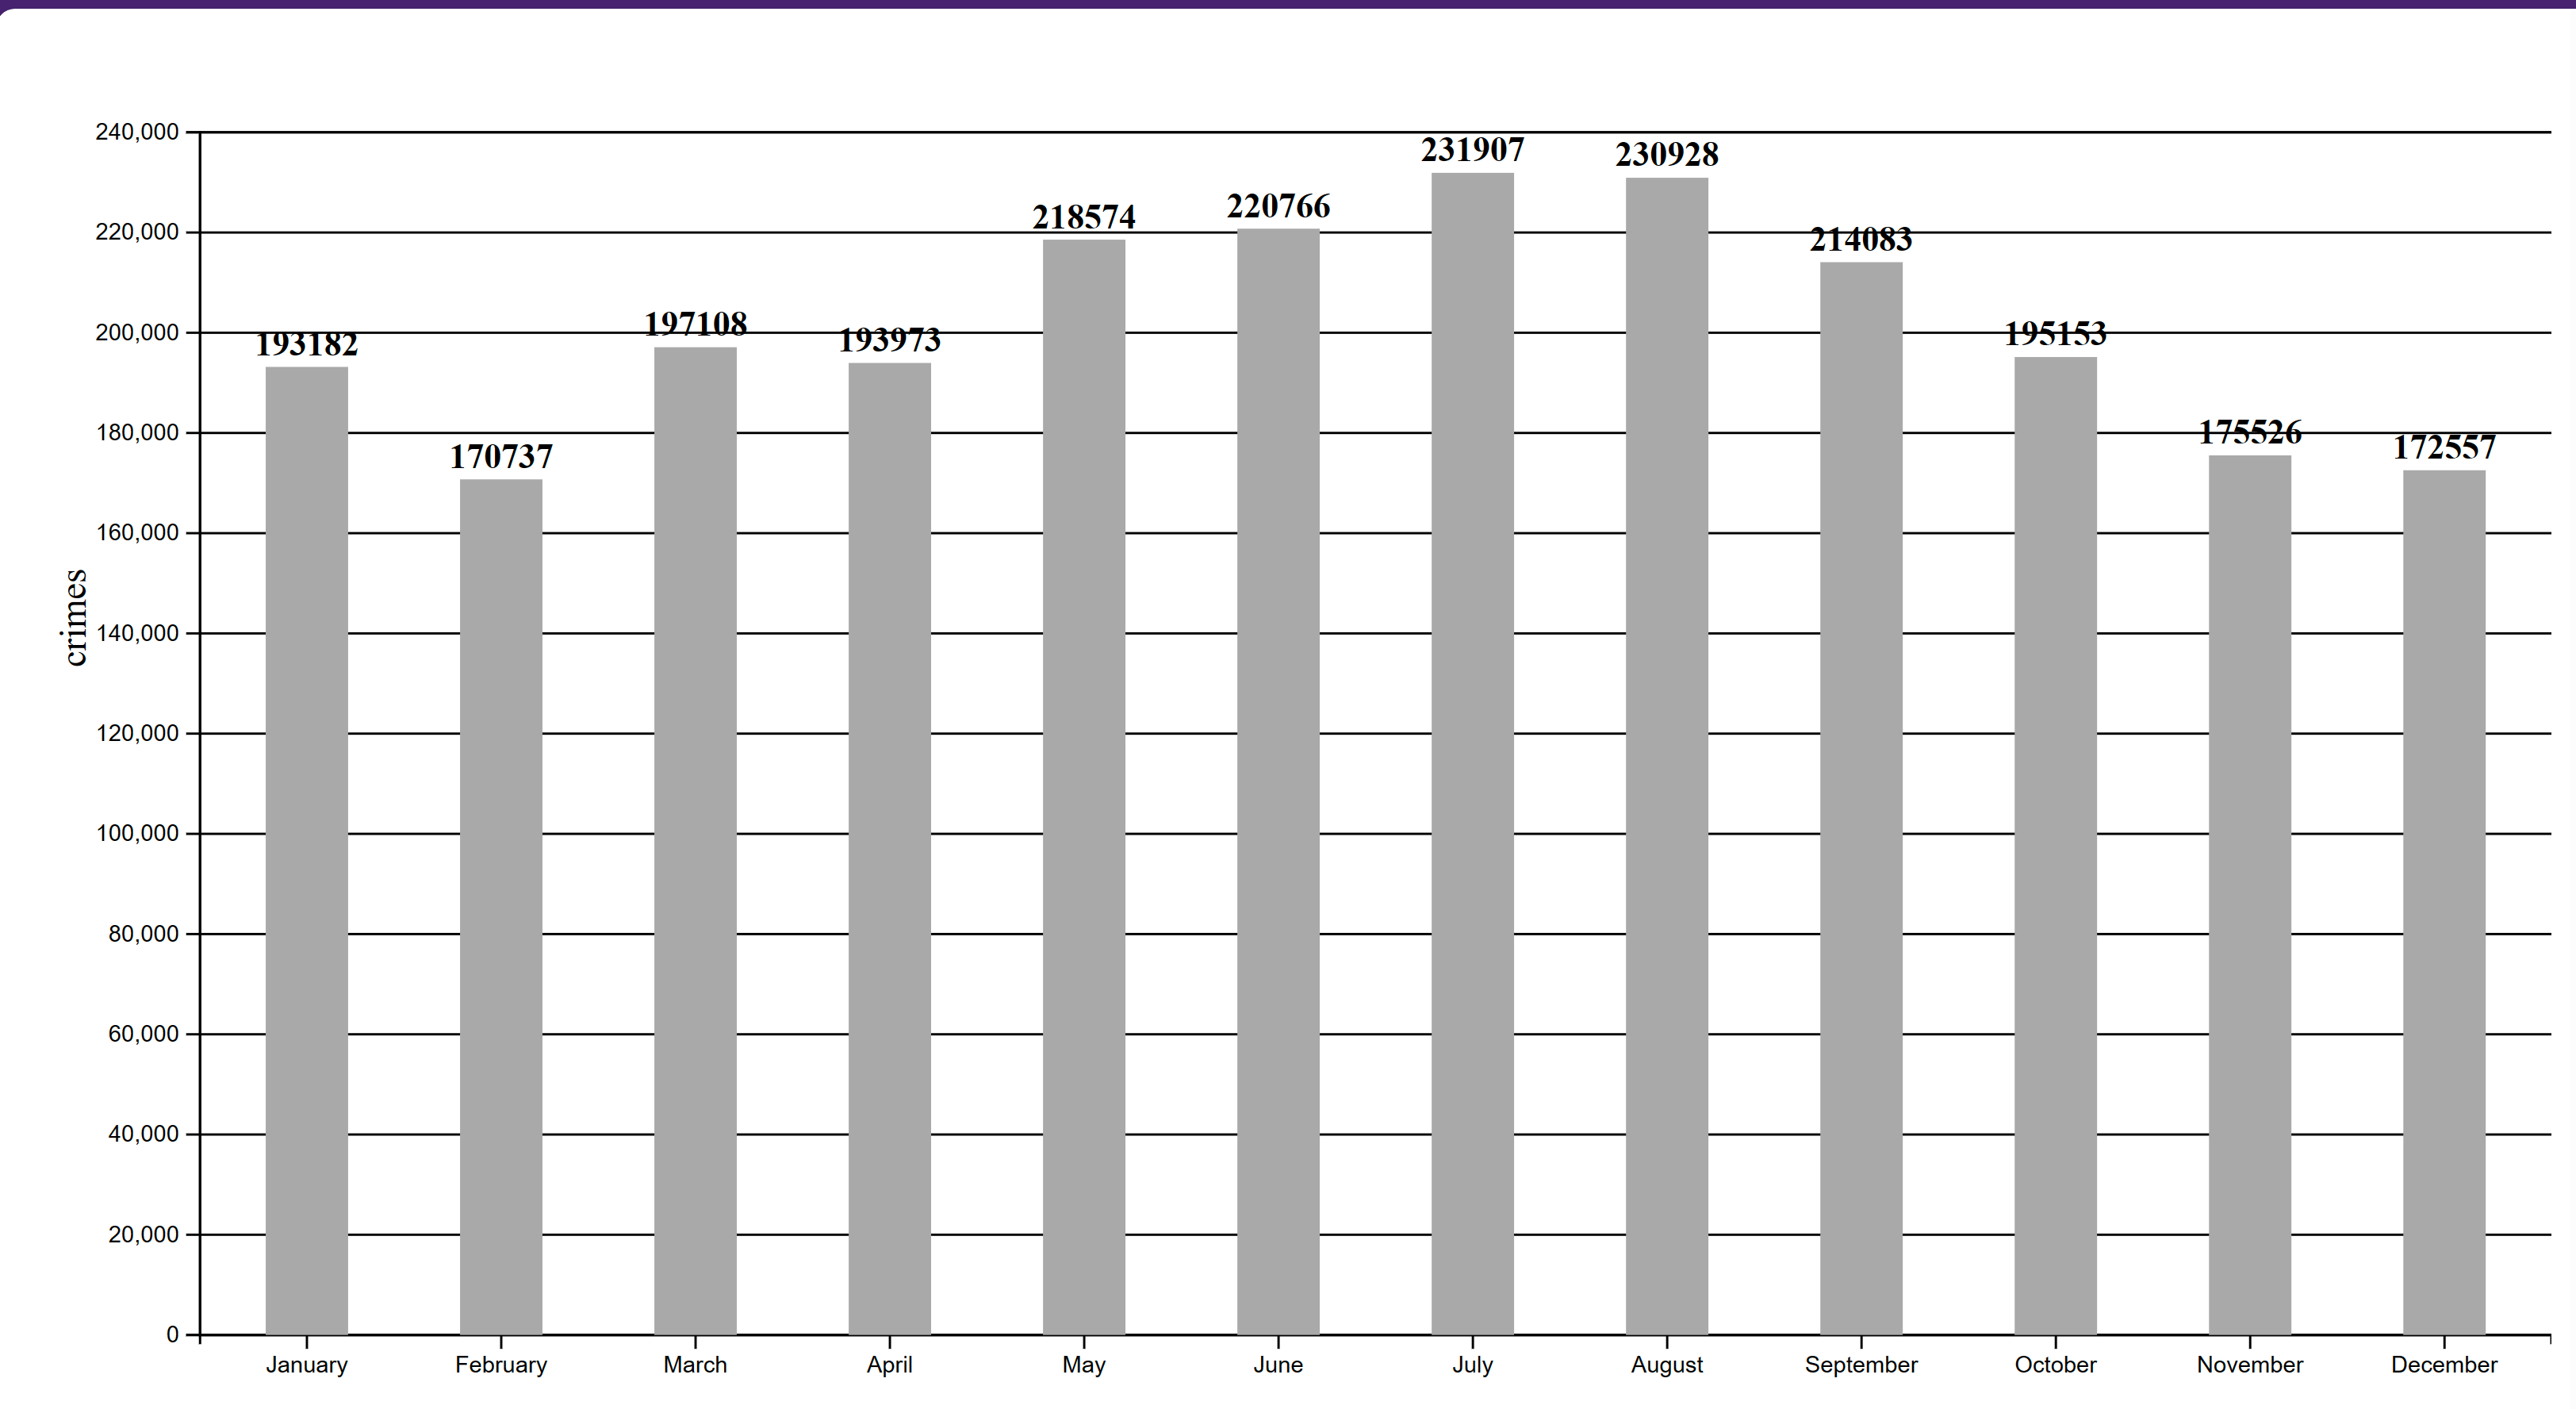
The provided plot is a bar chart visualization of crime data across different months of a year.
Short Description: The chart depicts the total number of crimes that occurred in each month, providing a clear visual comparison across the years.
Attributes Being Visualized: The two main attributes visualized are the months of the year on the horizontal axis and the total number of crimes on the vertical axis. Each bar represents the aggregate number of crimes for a corresponding month.
Interaction Mechanisms: The JavaScript code for the bar chart implements interactive features using D3.js, including mouseover events for dynamic response when hovering over chart elements, and zoom and brush functions for detailed data exploration. These interactions allow users to engage with the visualization, such as highlighting specific bars, displaying detailed information, and examining particular sections of the data more closely. Through these mechanisms, the chart not only presents data but also invites users to interact with it for a more informative and user-centric experience.
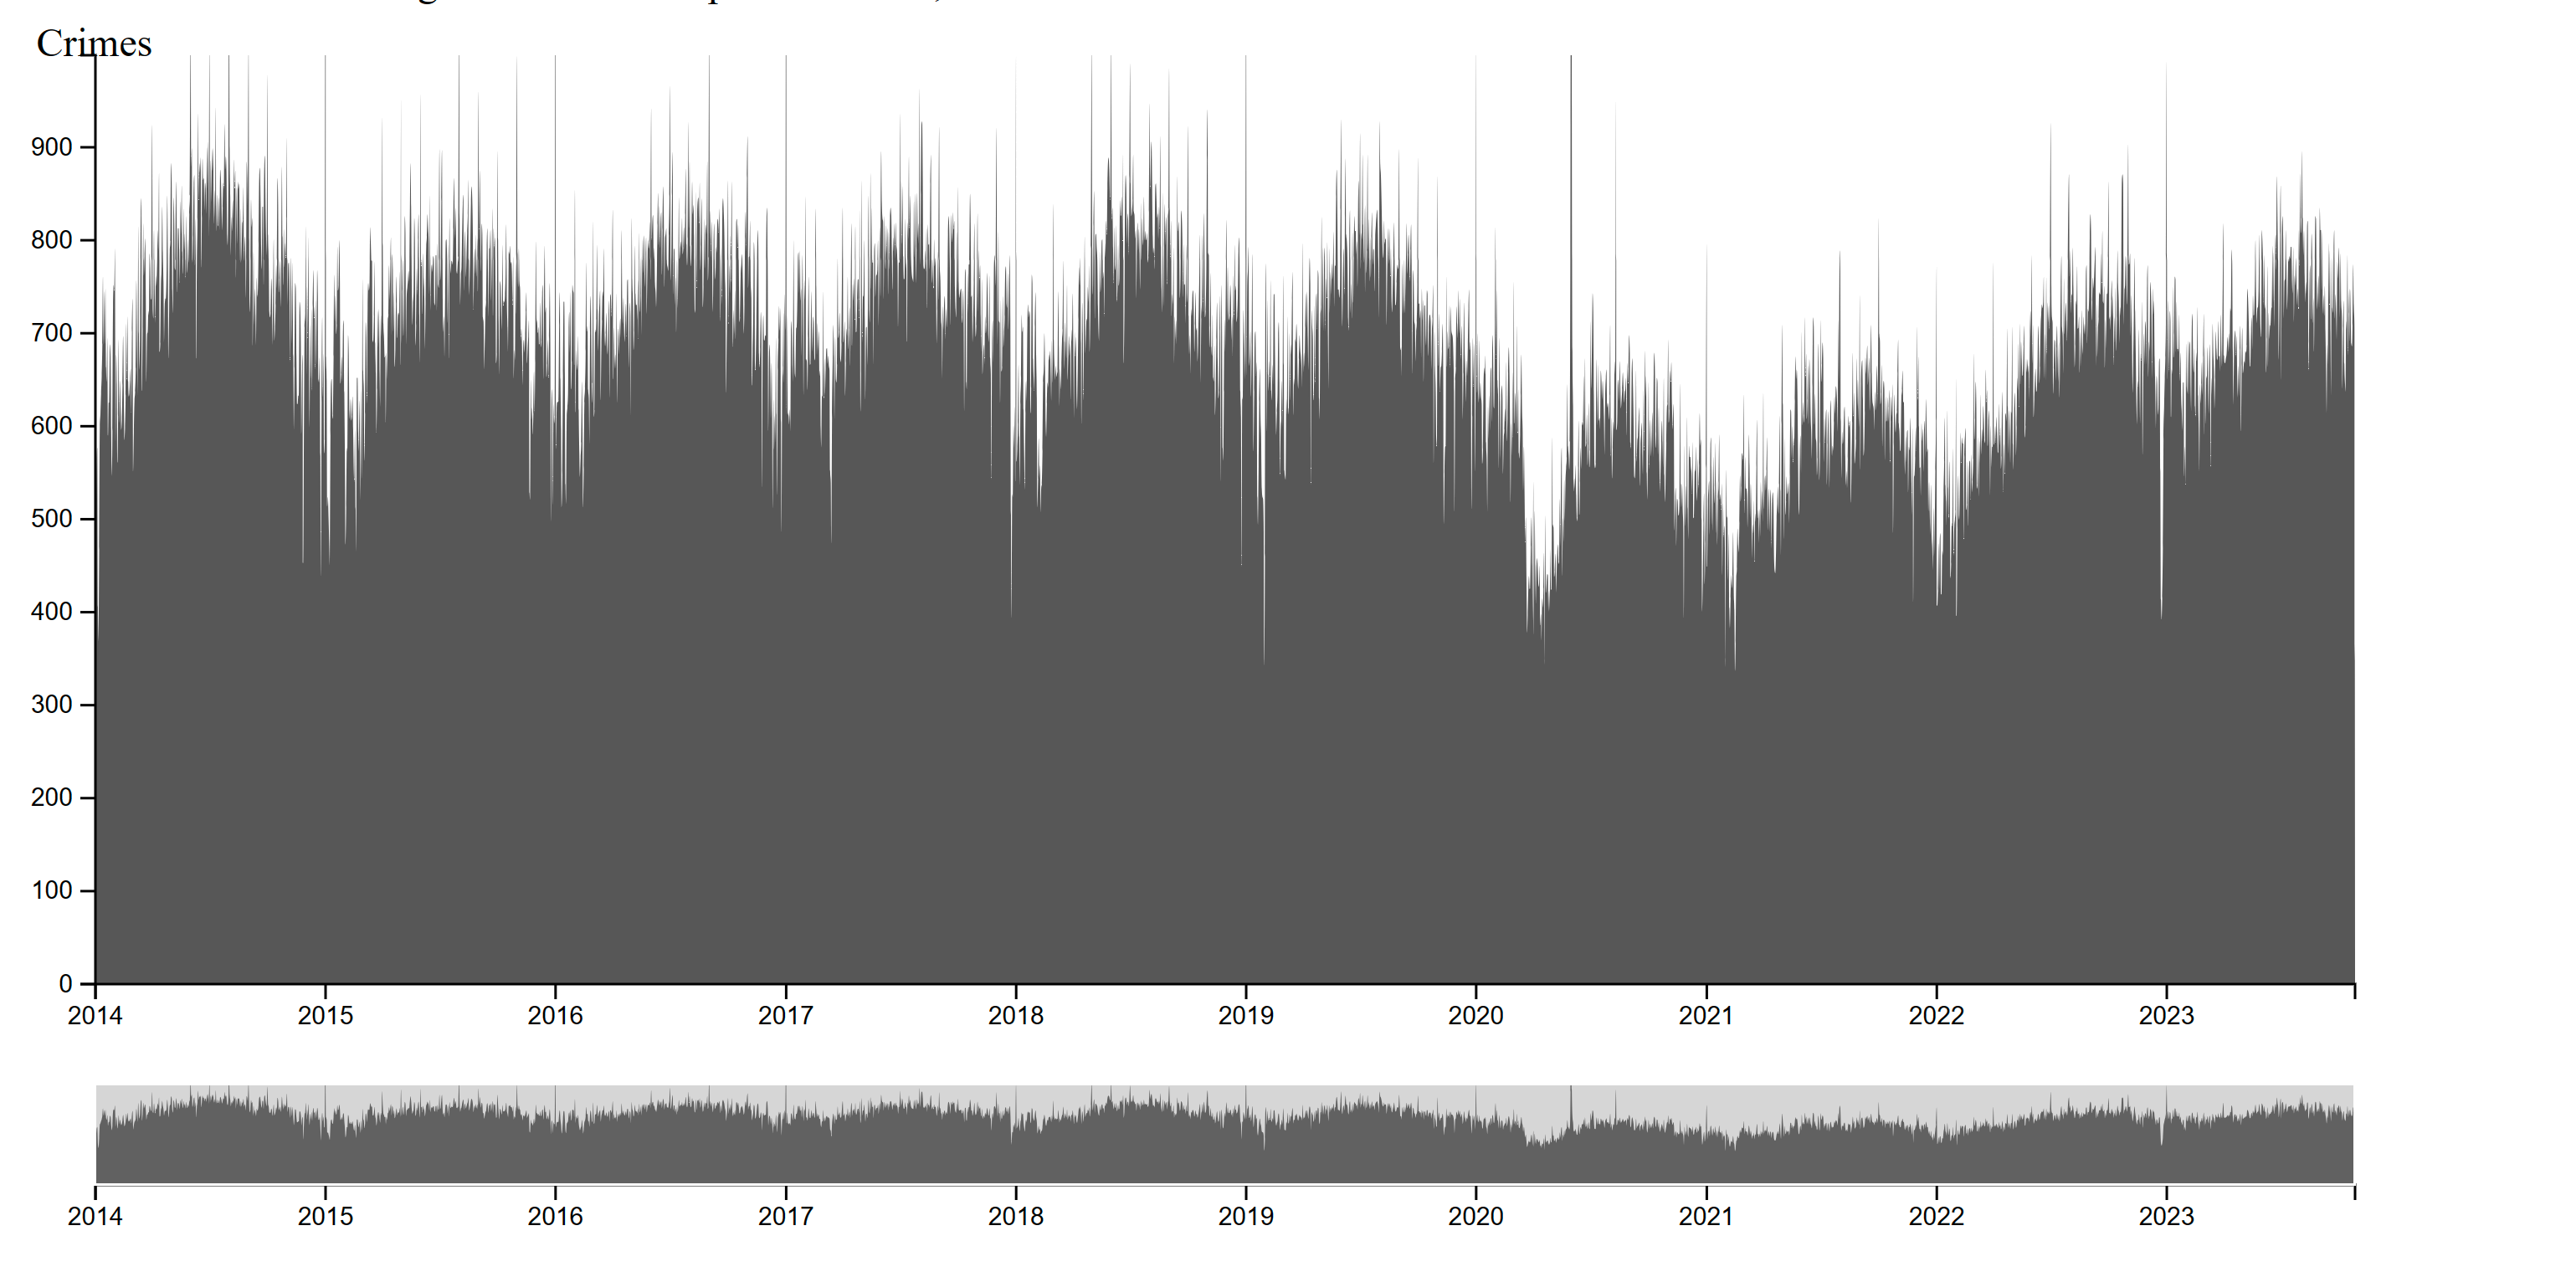
Description: This is an interactive time series plot showing crime trends from 2014 to 2023 using D3.js. It displays the number of crimes over time using an area chart. The top chart shows the focused view and the bottom provides context.
Attributes visualized: The main attribute visualized is the number of crimes over time.
Interaction Mechanism & Methods: The interactions allow panning and zooming:
-
Brushing on the context chart zooms the focus chart
-
Double-clicking on the focus chart zooms in
-
Scrolling on the focus chart pans the view. The linked views connect brushing on the context chart to zooming the focus chart. This allows drilling down on specific date ranges.
In summary, this is an interactive time series visualization allowing zooming, panning, and linked views to explore crime trends over time. The core interactions took significant development effort but provide a powerful analytic interface.
Overall, the linked brushing between focus and context charts and the flexible panning, zooming, clipping behaviors would be difficult to achieve in Vega-Lite. Vega-Lite's interaction capabilities are more limited compared to the low-level control provided by D3.
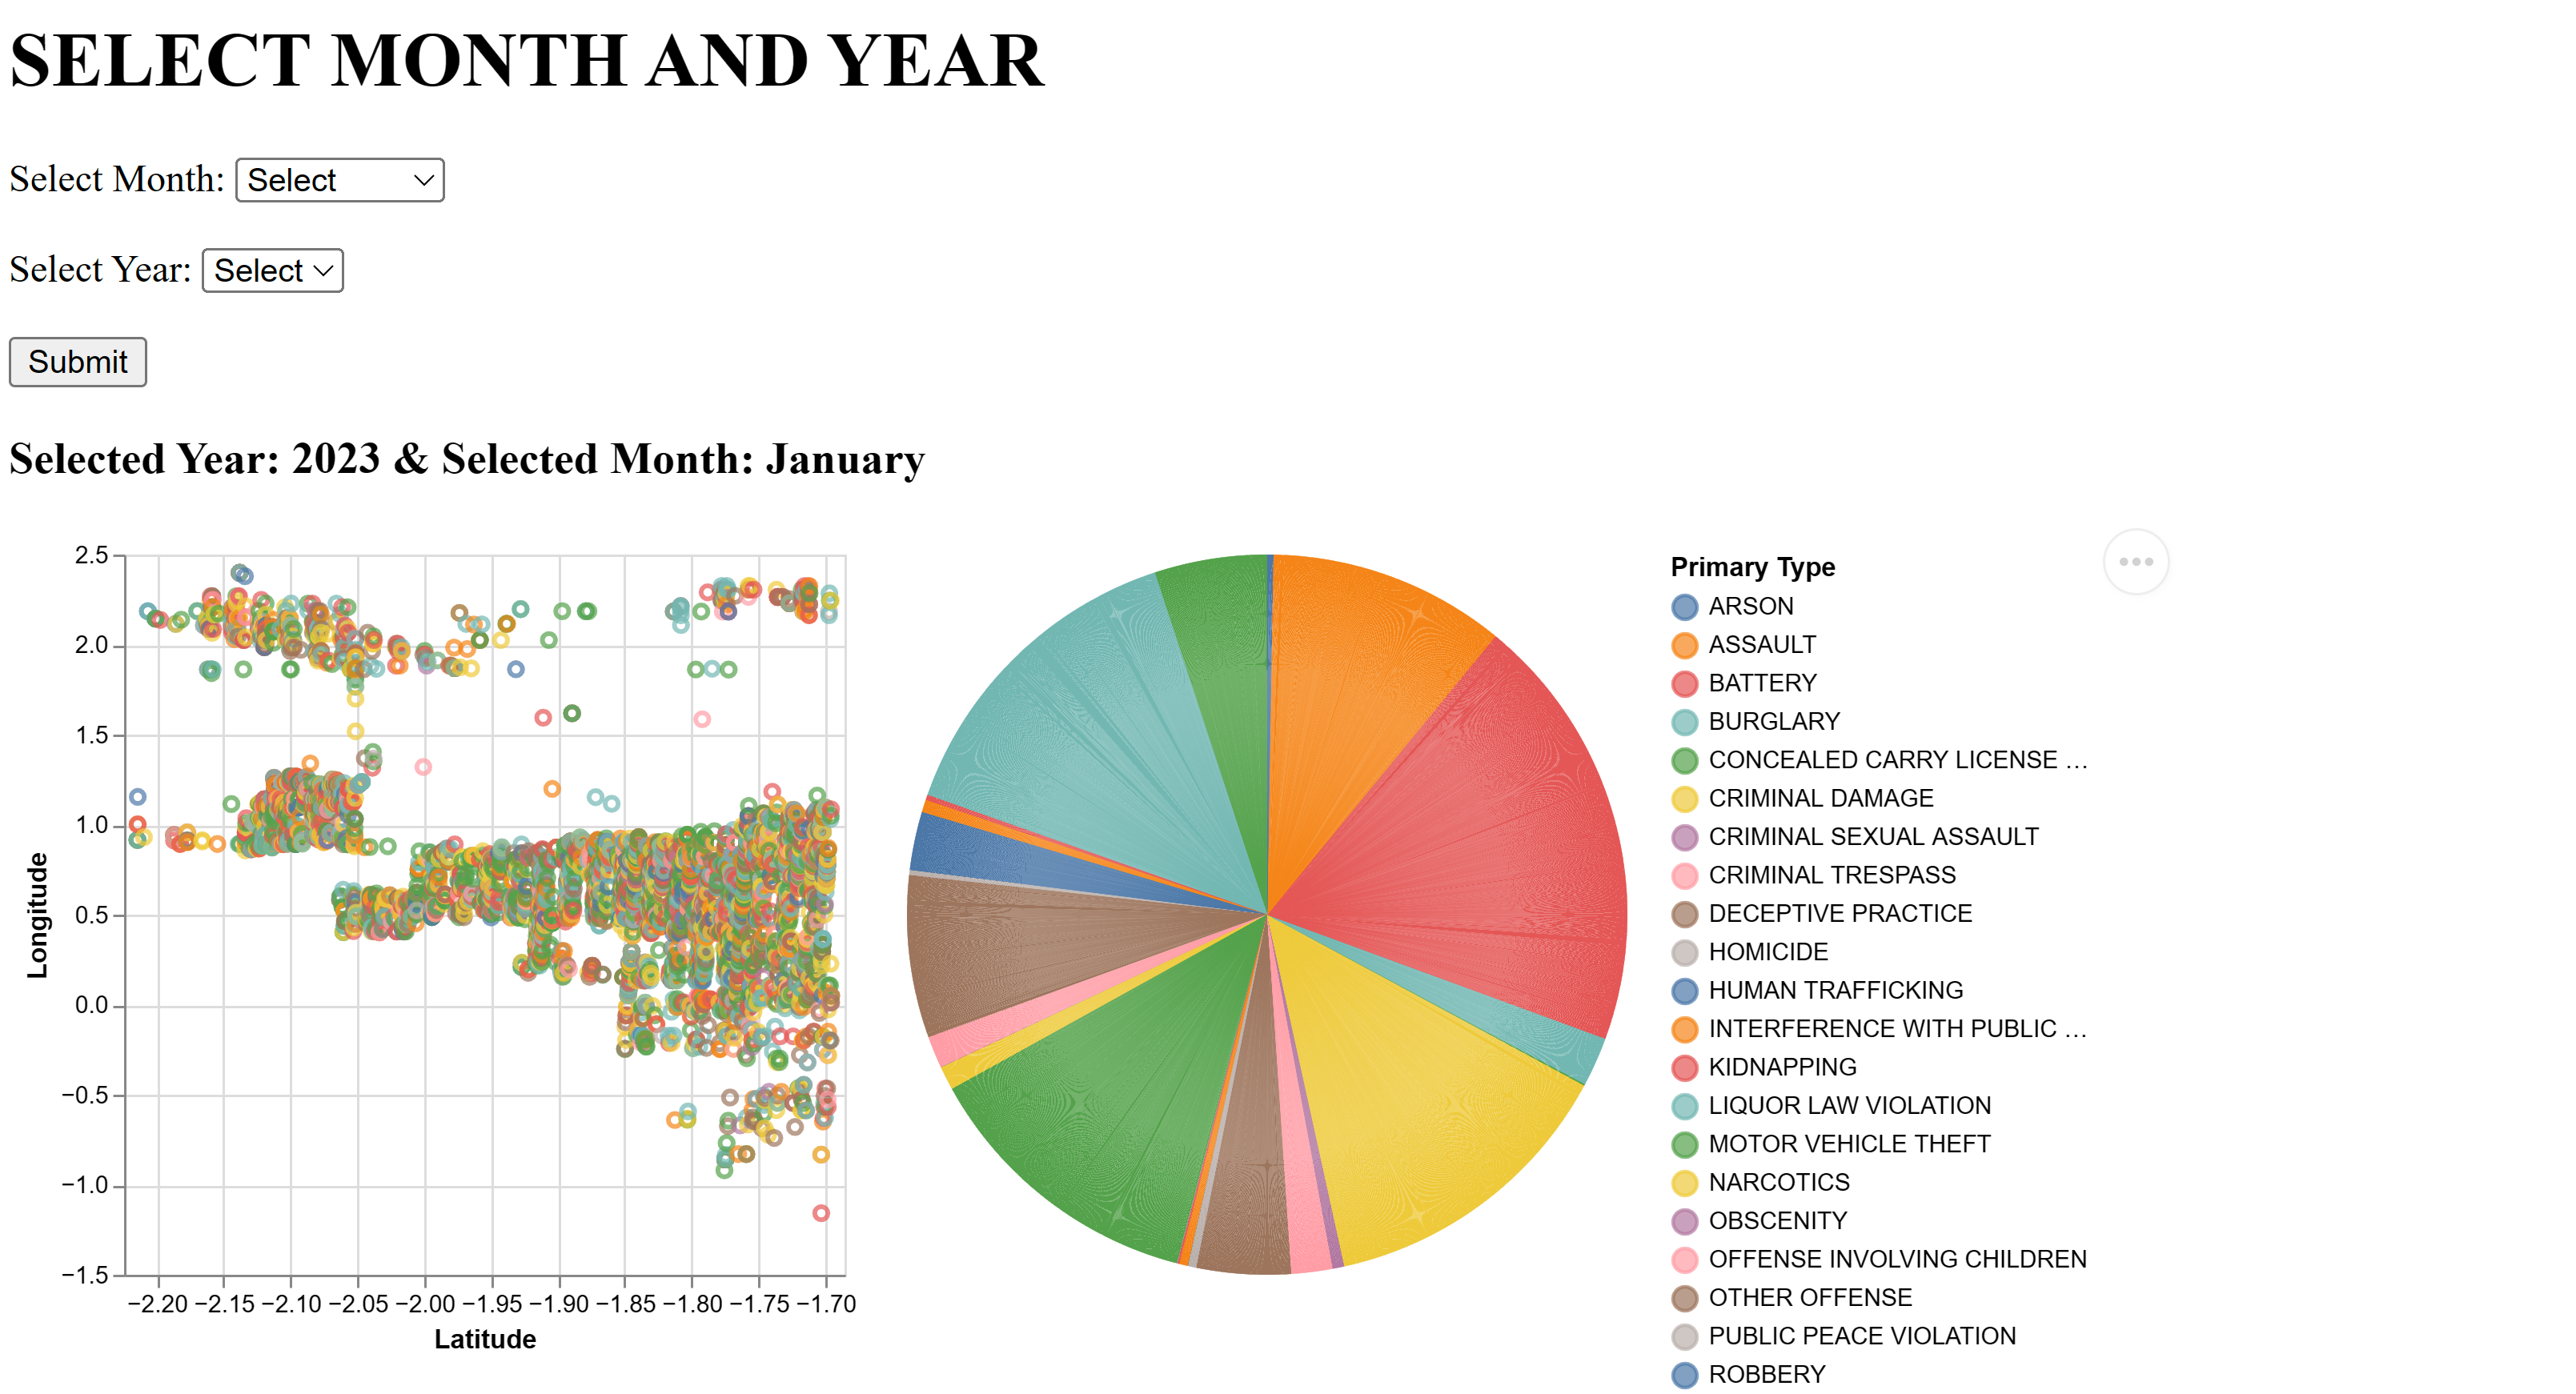
Short description: The visualization offers an interactive analysis of Chicago crime incidents, with selectable filters to explore monthly data across the years 2014 to 2023. It features a scatter plot showing the geographic distribution of crimes based on latitude and longitude for the chosen period, and a pie chart detailing the proportion of various crime categories. Users can select different months and years to dynamically update the visualization, gaining insights into spatial and categorical crime trends over time.
Attributes Being Visualized: The scatter plot attributes include geographic coordinates (latitude and longitude), visualizing the spatial distribution of crimes. The pie chart shows the proportion of crime types, with each slice representing a different category of crime.
Interaction Mechanisms and Methods: The visualization includes interactive mechanisms like dropdown menus for selecting the month and year, which dynamically update the plots. Tooltips also appear upon hovering over individual pie slices to provide the particular crime types . The visualisation also has the ability to click on elements within the plots to drill down into more detailed data.
Short Description: The visualizations enable a user to select and view crime data either in aggregate or by individual crime types. The choropleth map displays the density of crimes across Chicago, while the bar chart provides a count of arrests versus non-arrests, which can be viewed for all crimes collectively or filtered for specific crimes.
Attributes Being Visualized: Spatial distribution of crime is shown on the map, and the bar chart displays the arrest counts. When a specific crime is selected, the visualizations update to reflect data for just that crime, presenting targeted insights into the patterns of arrests.
Interaction Mechanisms and Methods: The users can interact with the visualizations through selection controls ie buttons, to choose between viewing all crimes or a specific crime. This selection triggers an update in the visualizations, showing the corresponding crime distribution on the map and arrest data in the bar chart.

Short description: The provided visualization offers a comprehensive view of crime trends in Chicago from 2014 to 2023, combining a geospatial representation of crime incidents with a temporal bar chart analysis. The map illustrates crime clusters in various locales, with interactive zooming to reveal detailed pin locations. The bar chart complements the map by displaying the total number of crimes for each year, allowing for a clear visual comparison of crime trends over the years.
Attributes Being Visualized: Spatial distribution of crimes is visualized on the map through clusters, while temporal trends are displayed on the bar chart with annual crime data. The map's clusters indicate the concentration of incidents, and the bar chart's vertical axis quantifies the crimes.
Interaction Mechanisms and Methods: Interactive features include zooming into map clusters to reveal individual incidents, hovering over map pins for detailed crime counts and information, and hovering over the bar chart to view yearly crime statistics.
GitHub - https://github.com/amanlaiq/Visualisation.github.io Live Web Hosted - https://amanlaiq.github.io/Visualisation.github.io/