feat(grafana json): update grafana json for nginx shared dict in prometheus #7529
Conversation
modify grafana json for nginx shared dict in prometheus
|
|
| "steppedLine": false, | ||
| "targets": [ | ||
| { | ||
| "expr": "(apisix_shared_dict_free_space_bytes * 100) / on (name) apisix_shared_dict_capacity_bytes", |
There was a problem hiding this comment.
If you are worried about showing instances will make the graph too complex, maybe we can add a comment that people can modify this query to show per-instance graph?
We can't add comment to a JSON file.
There was a problem hiding this comment.
If you are worried about showing instances will make the graph too complex, maybe we can add a comment that people can modify this query to show per-instance graph?
Does you mean add a comment like # we can modify the expr to show per-instance graph in json file?
update grafana json for nginx shared dict in prometheus
Description
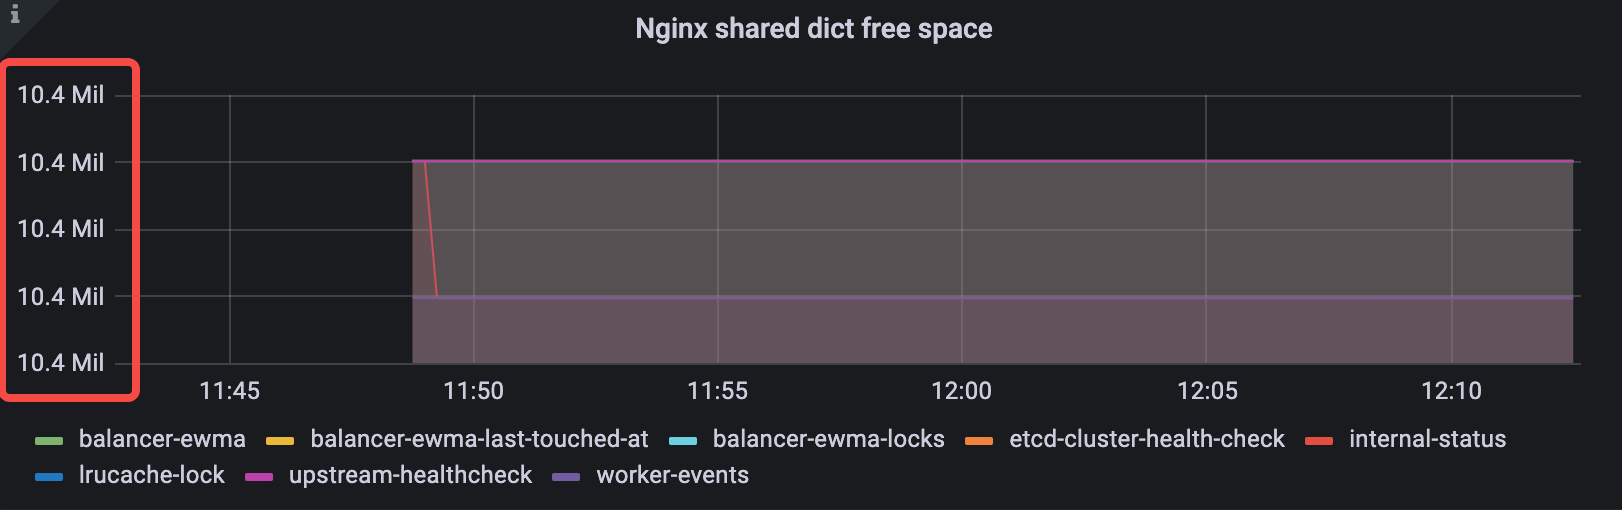
update grafana json to add nginx shared dict, which default config is
internal-status|upstream-healthcheck|worker-events|lrucache-lock|balancer-ewma|balancer-ewma-locks|balancer-ewma-last-touched-at|etcd-cluster-health-check.Fixes # (issue)
Checklist