echart gl中的scatter3D与bar3D在地图上的显示高度不一致问题 #11076
Description
Version
4.2.1
Steps to reproduce
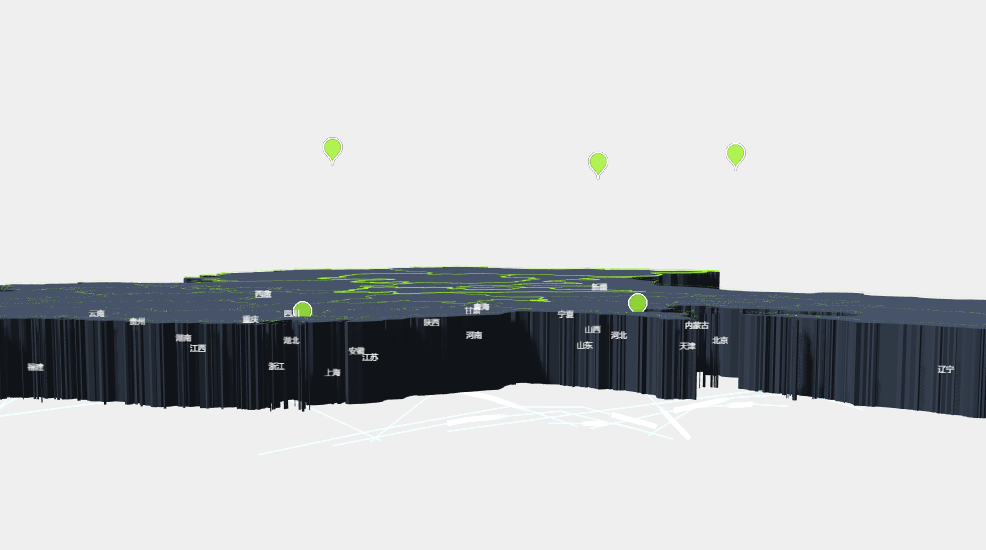
1.柱状图的最小值在地图上没有高度
2.当地图上不存在柱状图的时候,气泡消失
后来发现是跑到地图下面去了,官方社区的实例中发现了这个问题
与下图所示类似:
option={
    mapbox3D:{
        ...
        boxHeight: 20,
    }
}
配置了三维地图的场景高度boxHeight
What is expected?
图形的高度以地图平面为起点来显示,起点value为0
What is actually happening?
图形的最小值在地图上显示没有高度,必须series bar3D系列项中配置minHeight才会有高度