When using xAxis type 'time' chart is not optimised and shows all data points, which makes performance very slow. #11704
Description
Version
4.5.0
Steps to reproduce
-
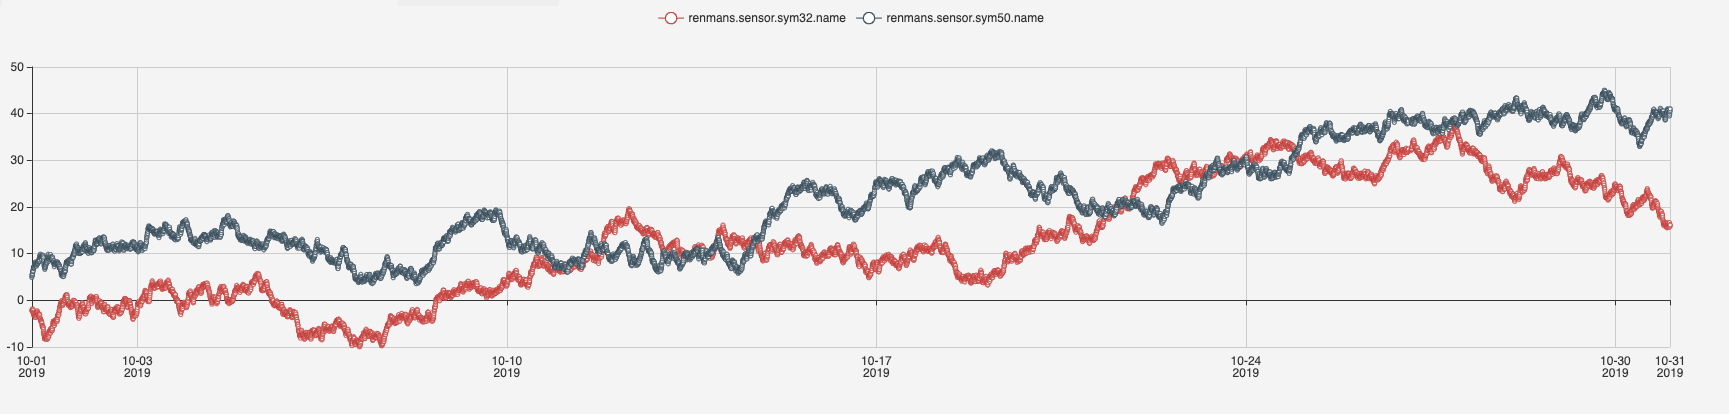
Have big series of data. (In my case it's over 8000 elements) e.g. series: [{data: [date, value]}]
-
Set xAxis type to 'category'. Chart will be smooth and performant.

-
Set xAxis type to 'time'. Chart will display all data point separately and perform very poorly.
What is expected?
I expect type: 'time' to optimise amount of data it shows in the same way type: 'category' works.
What is actually happening?
All data points are shown.
I tried setting different properties such as 'interval', but none of them had any effect on chart rendering. I could not find any examples that show 'time' series with large amount of data.