I generate a map with echarts.
I'm able to pickup 0 values to colorize them in gray using visualMap property combined with inRange min, max, outOfRange options.
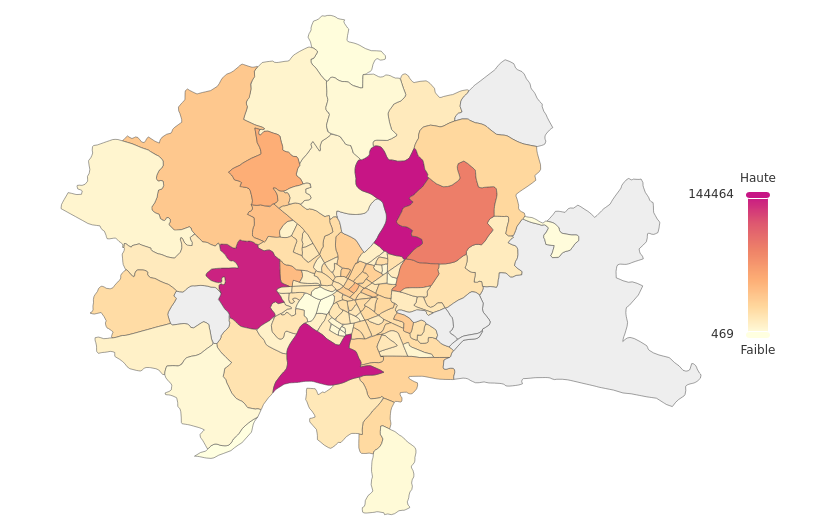
The wanted result is almost there (see the screenshot) !
But I'd like to display elements with 0 values with stripes / pattern - now in gray on the screenshot. How can I achieve this with echarts ?
Example of wanted pattern :

See screenshot :
I had a look on following documentation - and tried some code with no success :
-
https://echarts.apache.org/en/option.html#visualMap
-
https://echarts.apache.org/en/option.html#aria.decal
-
https://echarts.apache.org/examples/en/editor.html?c=pie-pattern
My visualMap configuration part is as follow :
    visualMap : {
                type: 'continuous',
                left : 'right',
                top : 'center',
                min : 469,
                max : 144464,
                inRange : {
                    color : colors
                },
                outOfRange: {
                    color:'#f4f4f4'
                },
                text : [ 'Haute', 'Faible' ],
                calculable : true
            },
Additional need : I'd also be happy to be able to see outOfRange in legend.
I generate a map with echarts.
I'm able to pickup 0 values to colorize them in gray using visualMap property combined with inRange min, max, outOfRange options.
The wanted result is almost there (see the screenshot) !
But I'd like to display elements with 0 values with stripes / pattern - now in gray on the screenshot. How can I achieve this with echarts ?
Example of wanted pattern :

See screenshot :

I had a look on following documentation - and tried some code with no success :
My visualMap configuration part is as follow :
Additional need : I'd also be happy to be able to see outOfRange in legend.