Version
5.2.1
Steps to Reproduce
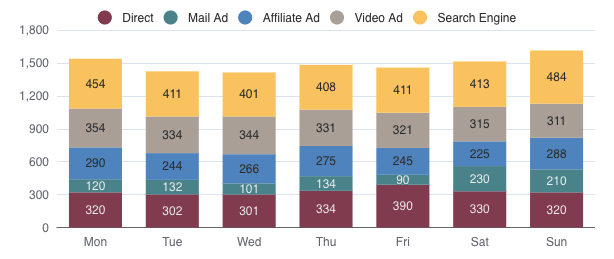
Normal stacked bar rendered with SVG. Height of chart container = 250px, width = 100%.
What is expected?
Expect all series in stack to touch each other without whitespace in between
What is actually happening?
Small gaps appear between layers of the stack. Gaps appear inconsistently and change with zoom level. This is most apparent in the turquoise series below:
Other Notes
One way this might be solved is to add a border to each bar series that is the same color as the series. I haven't been able to figure out how to apply the same color to the border of the bar. Is there a way to reference the color palette used for multiple series? E.g., for the first series in a chart, how could I reference the first color in the global palette to use elsewhere in the chart?
Version
5.2.1
Steps to Reproduce
Normal stacked bar rendered with SVG. Height of chart container = 250px, width = 100%.
What is expected?
Expect all series in stack to touch each other without whitespace in between
What is actually happening?
Small gaps appear between layers of the stack. Gaps appear inconsistently and change with zoom level. This is most apparent in the turquoise series below:

Other Notes
One way this might be solved is to add a border to each bar series that is the same color as the series. I haven't been able to figure out how to apply the same color to the border of the bar. Is there a way to reference the color palette used for multiple series? E.g., for the first series in a chart, how could I reference the first color in the global palette to use elsewhere in the chart?