const customSeries = []
this.chartData.seriesData.forEach(item => {
customSeries.push({
name: item.name,
type: 'bar',
data: item.data,
animationDuration,
barWidth: 30,
emphasis: {
focus: 'series'
}
})
})

  this.chart = echarts.init(this.$el, 'macarons')
  this.chart.setOption({
    title: {
      text: this.title
    },
    tooltip: {
      trigger: 'axis',
      showDelay: 10,
      axisPointer: { // 坐标轴指示器,坐标轴触发有效
        type: 'shadow' // 默认为直线,可选为:'line' | 'shadow'
      },
      textStyle: {
        color: '#fff'
      },
      formatter: (params) => {
        let sum = 0
        let mainTip = ''
        params.forEach((data, index) => {
          sum  = data.value
          mainTip  = (data.marker)   (data.seriesName   ':'   data.value)
          if (index !== params.length - 1) {
            mainTip  = '<br />'
          }
        })
        return `${params[0].axisValue}<br />总计:${sum}<br />${mainTip}`
      }
    },
    grid: {
      left: '0%',
      right: '1%',
      bottom: '2%',
      containLabel: true
    },
    xAxis: [{
      type: 'category',
      data: this.chartData.xAxisData,
      axisTick: {
        alignWithLabel: true
      }
    }],
    yAxis: [{
      type: 'value',
      axisTick: {
        show: false
      }
    }],
    legend: {
      left: 'right',
      top: '0%'
    },
    series: customSeries
  })
Version
5.2.2
Steps to reproduce
如上这个效果,求助,代码设置如下:
`
`
What is expected?
What is actually happening?
没有API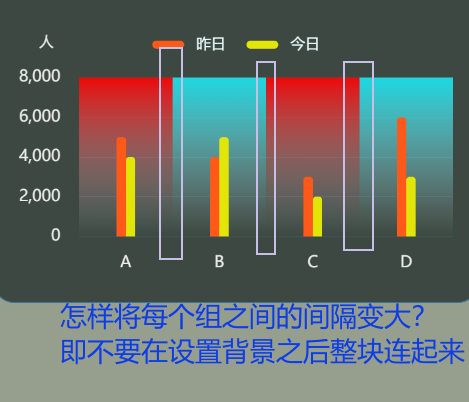
设置组间间隔