Issue with pie chart when data objects array is built up by two arrays: data point array + x-axis data array #16375
Description
Version
5.2.2
Link to Minimal Reproduction
No response
Steps to Reproduce
With:
      options= {
        tooltip: {
          trigger: 'item'
        },
        legend: {
          orient: 'vertical',
          left: 'left'
        },
        series: [
          {
            type: 'pie',
            radius: '100%',
            //data: psSeriesData,
            //data: seriesData,
            data: [
              { value: 820, name: 'Mon' },
              { value: 932, name: 'Tue' },
              { value: 901, name: 'Wed' },
              { value: 934, name: 'Thu' },
              { value: 1290, name: 'Fri' },
              { value: 1330, name: 'Sat' },
              { vaue: 1320, name: 'Sun' }
            ],
            emphasis: {
              itemStyle: {
                shadowBlur: 10,
                shadowOffsetX: 0,
                shadowColor: 'rgba(0, 0, 0, 0.5)'
              }
            }
          }
        ]
      };
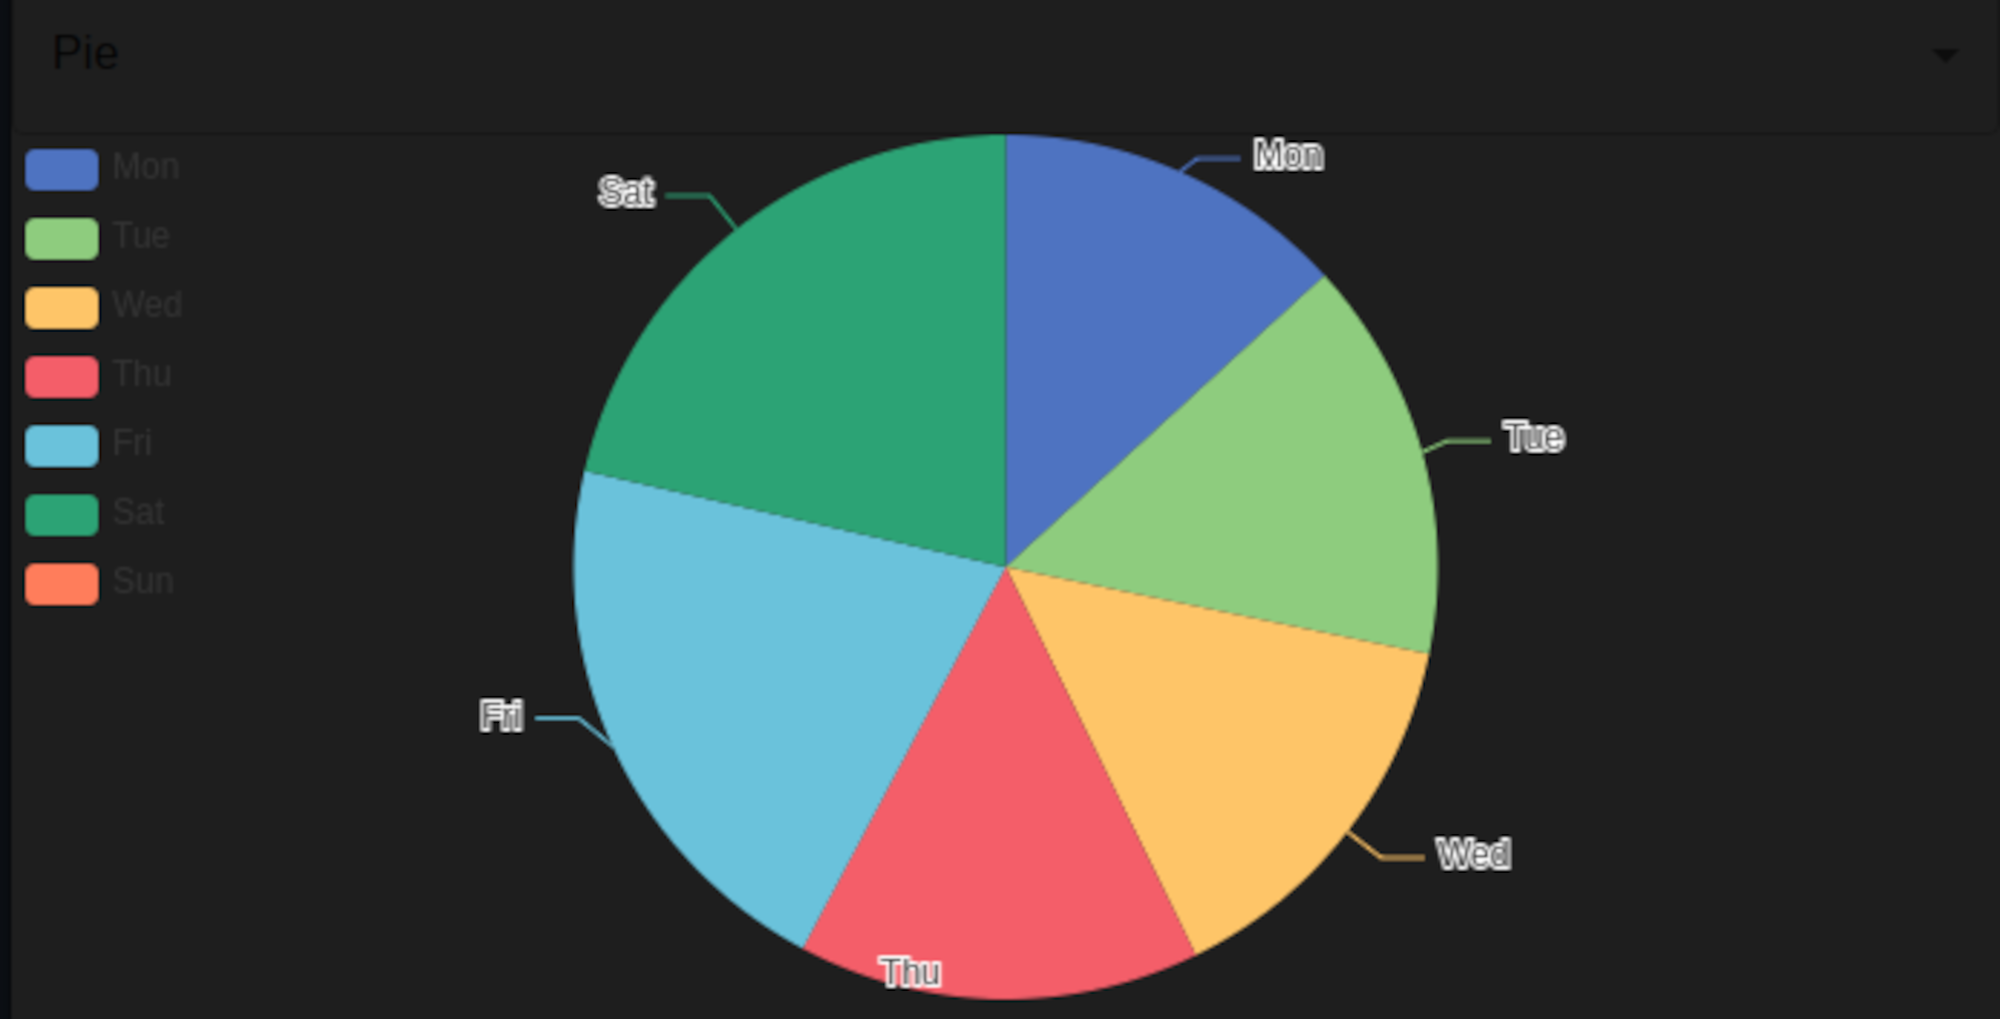
I get the correct pie chart :
But when I "build-up" the data from two separated arrays, a data-points array and a x-axis category array :
export default function EchartDeploy (props: Props) {

  const { chartType, seriesData, xAxisType, xAxisData } = props

  const psSeriesDataBuild = (sd: number[], xaxisd: string[]): psDataType[] => {
    let psDataArray : psDataType[] = []
    for(let i = 0; i < sd.length; i++) {
      const psDataPair: psDataType = {
        dataPoint: sd[i],
        name: xaxisd[i]
      }
      psDataArray.push(psDataPair)
    }
    return psDataArray
  }

  const psSeriesDataPrint = (psSeriesD: psDataType[]) => {
    for (let i = 0; i < psSeriesD.length; i++) {
      console.log("{ value: " + psSeriesD[i].dataPoint + ", name: " + psSeriesD[i].name + " }")
    }
  }

      options= {
        tooltip: {
          trigger: 'item'
        },
        legend: {
          orient: 'vertical',
          left: 'left'
        },
        series: [
          {
            type: 'pie',
            radius: '100%',
            data: psSeriesData,
            //data: seriesData,
            //data: [
              //{ value: 820, name: 'Mon' },
              //{ value: 932, name: 'Tue' },
              //{ value: 901, name: 'Wed' },
              //{ value: 934, name: 'Thu' },
              //{ value: 1290, name: 'Fri' },
              //{ value: 1330, name: 'Sat' },
              //{ vaue: 1320, name: 'Sun' }
            //],
            emphasis: {
              itemStyle: {
                shadowBlur: 10,
                shadowOffsetX: 0,
                shadowColor: 'rgba(0, 0, 0, 0.5)'
              }
            }
          }
        ]
      };
Current Behavior
With:
      options= {
        tooltip: {
          trigger: 'item'
        },
        legend: {
          orient: 'vertical',
          left: 'left'
        },
        series: [
          {
            type: 'pie',
            radius: '100%',
            //data: psSeriesData,
            //data: seriesData,
            data: [
              { value: 820, name: 'Mon' },
              { value: 932, name: 'Tue' },
              { value: 901, name: 'Wed' },
              { value: 934, name: 'Thu' },
              { value: 1290, name: 'Fri' },
              { value: 1330, name: 'Sat' },
              { vaue: 1320, name: 'Sun' }
            ],
            emphasis: {
              itemStyle: {
                shadowBlur: 10,
                shadowOffsetX: 0,
                shadowColor: 'rgba(0, 0, 0, 0.5)'
              }
            }
          }
        ]
      };
I get the correct pie chart :
But when I "build-up" the data from two separated arrays, a data-points array and a x-axis category array :
export default function EchartDeploy (props: Props) {

  const { chartType, seriesData, xAxisType, xAxisData } = props

  const psSeriesDataBuild = (sd: number[], xaxisd: string[]): psDataType[] => {
    let psDataArray : psDataType[] = []
    for(let i = 0; i < sd.length; i++) {
      const psDataPair: psDataType = {
        dataPoint: sd[i],
        name: xaxisd[i]
      }
      psDataArray.push(psDataPair)
    }
    return psDataArray
  }

  const psSeriesDataPrint = (psSeriesD: psDataType[]) => {
    for (let i = 0; i < psSeriesD.length; i++) {
      console.log("{ value: " + psSeriesD[i].dataPoint + ", name: " + psSeriesD[i].name + " }")
    }
  }

      options= {
        tooltip: {
          trigger: 'item'
        },
        legend: {
          orient: 'vertical',
          left: 'left'
        },
        series: [
          {
            type: 'pie',
            radius: '100%',
            data: psSeriesData,
            //data: seriesData,
            //data: [
              //{ value: 820, name: 'Mon' },
              //{ value: 932, name: 'Tue' },
              //{ value: 901, name: 'Wed' },
              //{ value: 934, name: 'Thu' },
              //{ value: 1290, name: 'Fri' },
              //{ value: 1330, name: 'Sat' },
              //{ vaue: 1320, name: 'Sun' }
            //],
            emphasis: {
              itemStyle: {
                shadowBlur: 10,
                shadowOffsetX: 0,
                shadowColor: 'rgba(0, 0, 0, 0.5)'
              }
            }
          }
        ]
      };
I end up with only the legend visible:

Despite the fact that the data object array seems correctly built:

What am I doing wrongly? How to make the correct pie chart visible using the data array built up by two distinct data point array and x axis data array?
Expected Behavior
Expected Output: the correct Pie Chart
Environment
- OS: Ubuntu 20.04 Desktop
- Browser: Chromium : Electron: version 13
- echart: 5.2.2
- echarts-for-react: 3.0.2
- node: v 16.13.0
- Framework: React : version 17.0.2
Any additional comments?
No response