Version
5.3
Link to Minimal Reproduction
https://echarts.apache.org/examples/zh/editor.html?c=line-simple
Steps to Reproduce
1.打开官网
2. 输入option = { xAxis: { type: 'category', data: ['Mon', 'Tue', 'Wed', 'Thu', 'Fri', 'Sat', 'Sun'] }, yAxis: { type: 'value' }, series: [ { data: [150, 230, 224, 218, 135, 147, 260], type: 'line', areaStyle: { opacity: 0.8, color: new echarts.graphic.LinearGradient(0, 0, 0, 1, [{ offset: 0, color: 'rgb(136, 193, 250, 1)' }, { offset: 1, color: 'rgb(255, 255, 255, 0)' } ]) } } ] };
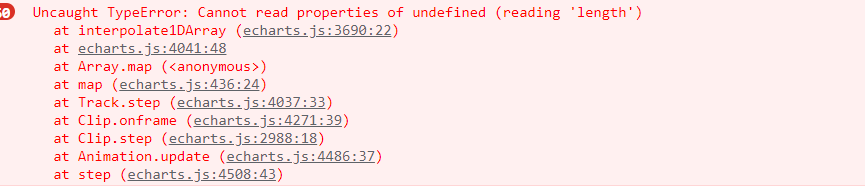
3.打开调试工具,就会出现报错
Current Behavior
出现报错,并且多次触发
Expected Behavior
正常运行
Environment
- OS:win10
- Browser:chrome 98
- Framework:react,webpack
Any additional comments?
Version
5.3
Link to Minimal Reproduction
https://echarts.apache.org/examples/zh/editor.html?c=line-simple
Steps to Reproduce
1.打开官网
2. 输入
option = { xAxis: { type: 'category', data: ['Mon', 'Tue', 'Wed', 'Thu', 'Fri', 'Sat', 'Sun'] }, yAxis: { type: 'value' }, series: [ { data: [150, 230, 224, 218, 135, 147, 260], type: 'line', areaStyle: { opacity: 0.8, color: new echarts.graphic.LinearGradient(0, 0, 0, 1, [{ offset: 0, color: 'rgb(136, 193, 250, 1)' }, { offset: 1, color: 'rgb(255, 255, 255, 0)' } ]) } } ] };3.打开调试工具,就会出现报错
Current Behavior
出现报错,并且多次触发
Expected Behavior
正常运行
Environment
Any additional comments?