[Bug] Unable to highlight the whole row programmatically and 'mouseover' event not getting triggered for area in chart with no data #16737
Description
Version
5.3.1
Link to Minimal Reproduction
No response
Steps to Reproduce
Code:
// prettier-ignore
let dataAxis = ['点', '击', '柱', '子', '或', '者', '两', '指', '在', '触', '屏', '上', '滑', '动', '能', '够', '自', '动', '缩', '放'];
// prettier-ignore
let data = [220, 182, 191, 234, 290, 330, 310, 123, 442, 321, 90, 149, 210, 122, 133, 334, 198, 123, 125, 220];
let yMax = 500;
let dataShadow = [];
for (let i = 0; i < data.length; i++) {
dataShadow.push(yMax);
}
option = {
title: {
text: '特性示例:渐变色 阴影 点击缩放',
subtext: 'Feature Sample: Gradient Color, Shadow, Click Zoom'
},
xAxis: {
data: dataAxis,
axisLabel: {
inside: true,
color: '#fff'
},
axisTick: {
show: false
},
axisLine: {
show: false
},
z: 10
},
yAxis: {
axisLine: {
show: false
},
axisTick: {
show: false
},
axisLabel: {
color: '#999'
}
},
dataZoom: [
{
type: 'inside'
}
],
series: [
{
type: 'bar',
showBackground: true,
itemStyle: {
color: new echarts.graphic.LinearGradient(0, 0, 0, 1, [
{ offset: 0, color: '#83bff6' },
{ offset: 0.5, color: '#188df0' },
{ offset: 1, color: '#188df0' }
])
},
emphasis: {
itemStyle: {
color: new echarts.graphic.LinearGradient(0, 0, 0, 1, [
{ offset: 0, color: '#2378f7' },
{ offset: 0.7, color: '#2378f7' },
{ offset: 1, color: '#83bff6' }
])
}
},
data: data
}
]
};
myChart.getZr().on('mouseover', function(params) {
console.log('mouseover');
});
myChart.getZr().on('click', function(params) {
console.log('clicked');
});
setInterval(function() {
myChart.dispatchAction({
type: 'highlight',
dataIndex: [0,1, 2,3,4,5,6,7,8,9]
});
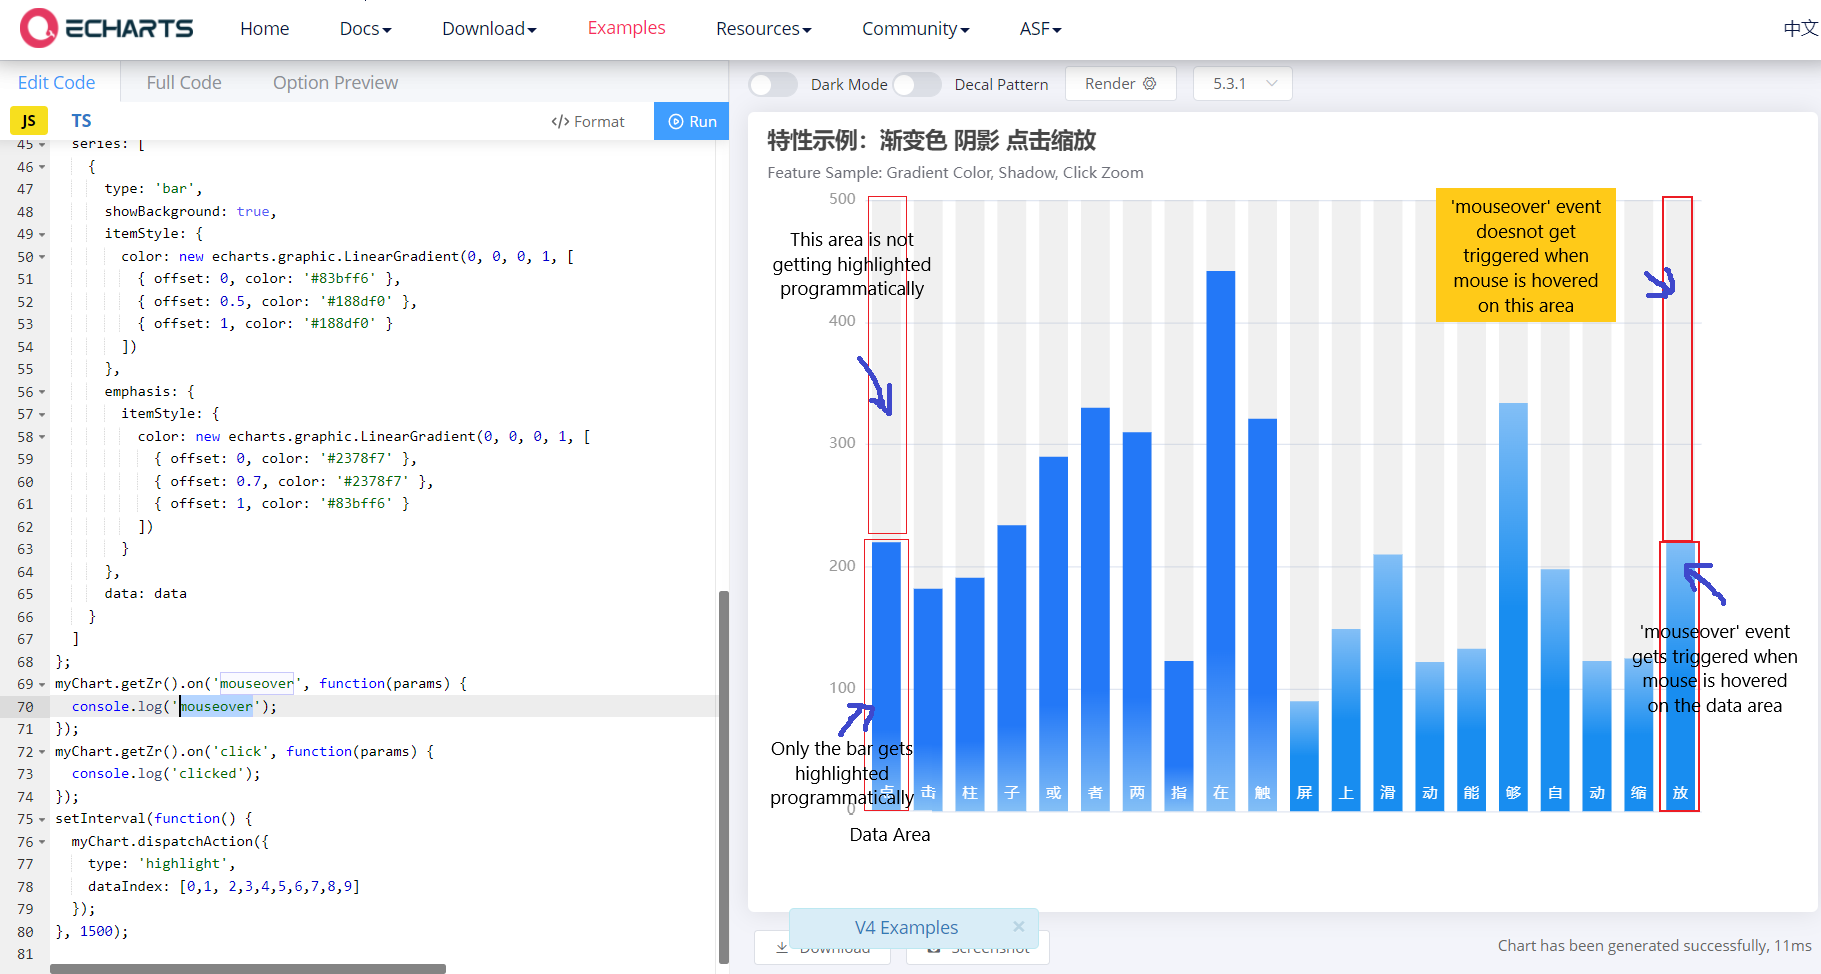
}, 1500);We are trying to achieve two things here:
- We want to highlight the whole row programmatically, using dispatchAction().
- We want to use the 'mouseover' event on the whole row (not just the bars).
Steps to reproduce:
-
'mouseover' event not getting triggered when we are hovering on the part of the chart where there is no data.
but the 'click' event gets triggered.
If we click on the area of the chart where there is no data, the click event gets triggered.Code used:
myChart.getZr().on('mouseover', function(params) {
  console.log('mouseover');
});
myChart.getZr().on('click', function(params) {
  console.log('clicked');
});- dispatchAction() only highlights the data bar, not the whole row.
Code used:
setInterval(function() {
  myChart.dispatchAction({
    type: 'highlight',
    dataIndex: [0,1, 2,3,4,5,6,7,8,9]
  });
}, 1500);
Current Behavior
-
'mouseover' event not getting triggered when we are hovering on the part of the chart where there is no data.
but the 'click' event gets triggered.
If we click on the area of the chart where there is no data, the click event gets triggered.Code used:
myChart.getZr().on('mouseover', function(params) {
  console.log('clicked');
});
myChart.getZr().on('click', function(params) {
  console.log('clicked');
});- dispatchAction() only highlights the data bar, not the whole row.
Code used:
setInterval(function() {
  myChart.dispatchAction({ type: 'highlight', dataIndex: [0,1, 2,3,4,5,6,7,8,9] });
}, 1500);
Expected Behavior
-
'mouseover' event should get triggered when we are hovering on the part of the chart where there is no data also.
and not just when we hover on the data bar. -
dispatchAction() should highlight the whole row.
Environment
- OS:
- Browser:
- Framework:
Any additional comments?