[Bug] Gaps and overlaps in stacked area chart #16879
Description
Version
5.3.2
Link to Minimal Reproduction
https://observablehq.com/d/fad93c2fc859cb2d
Steps to Reproduce
See the link
Current Behavior
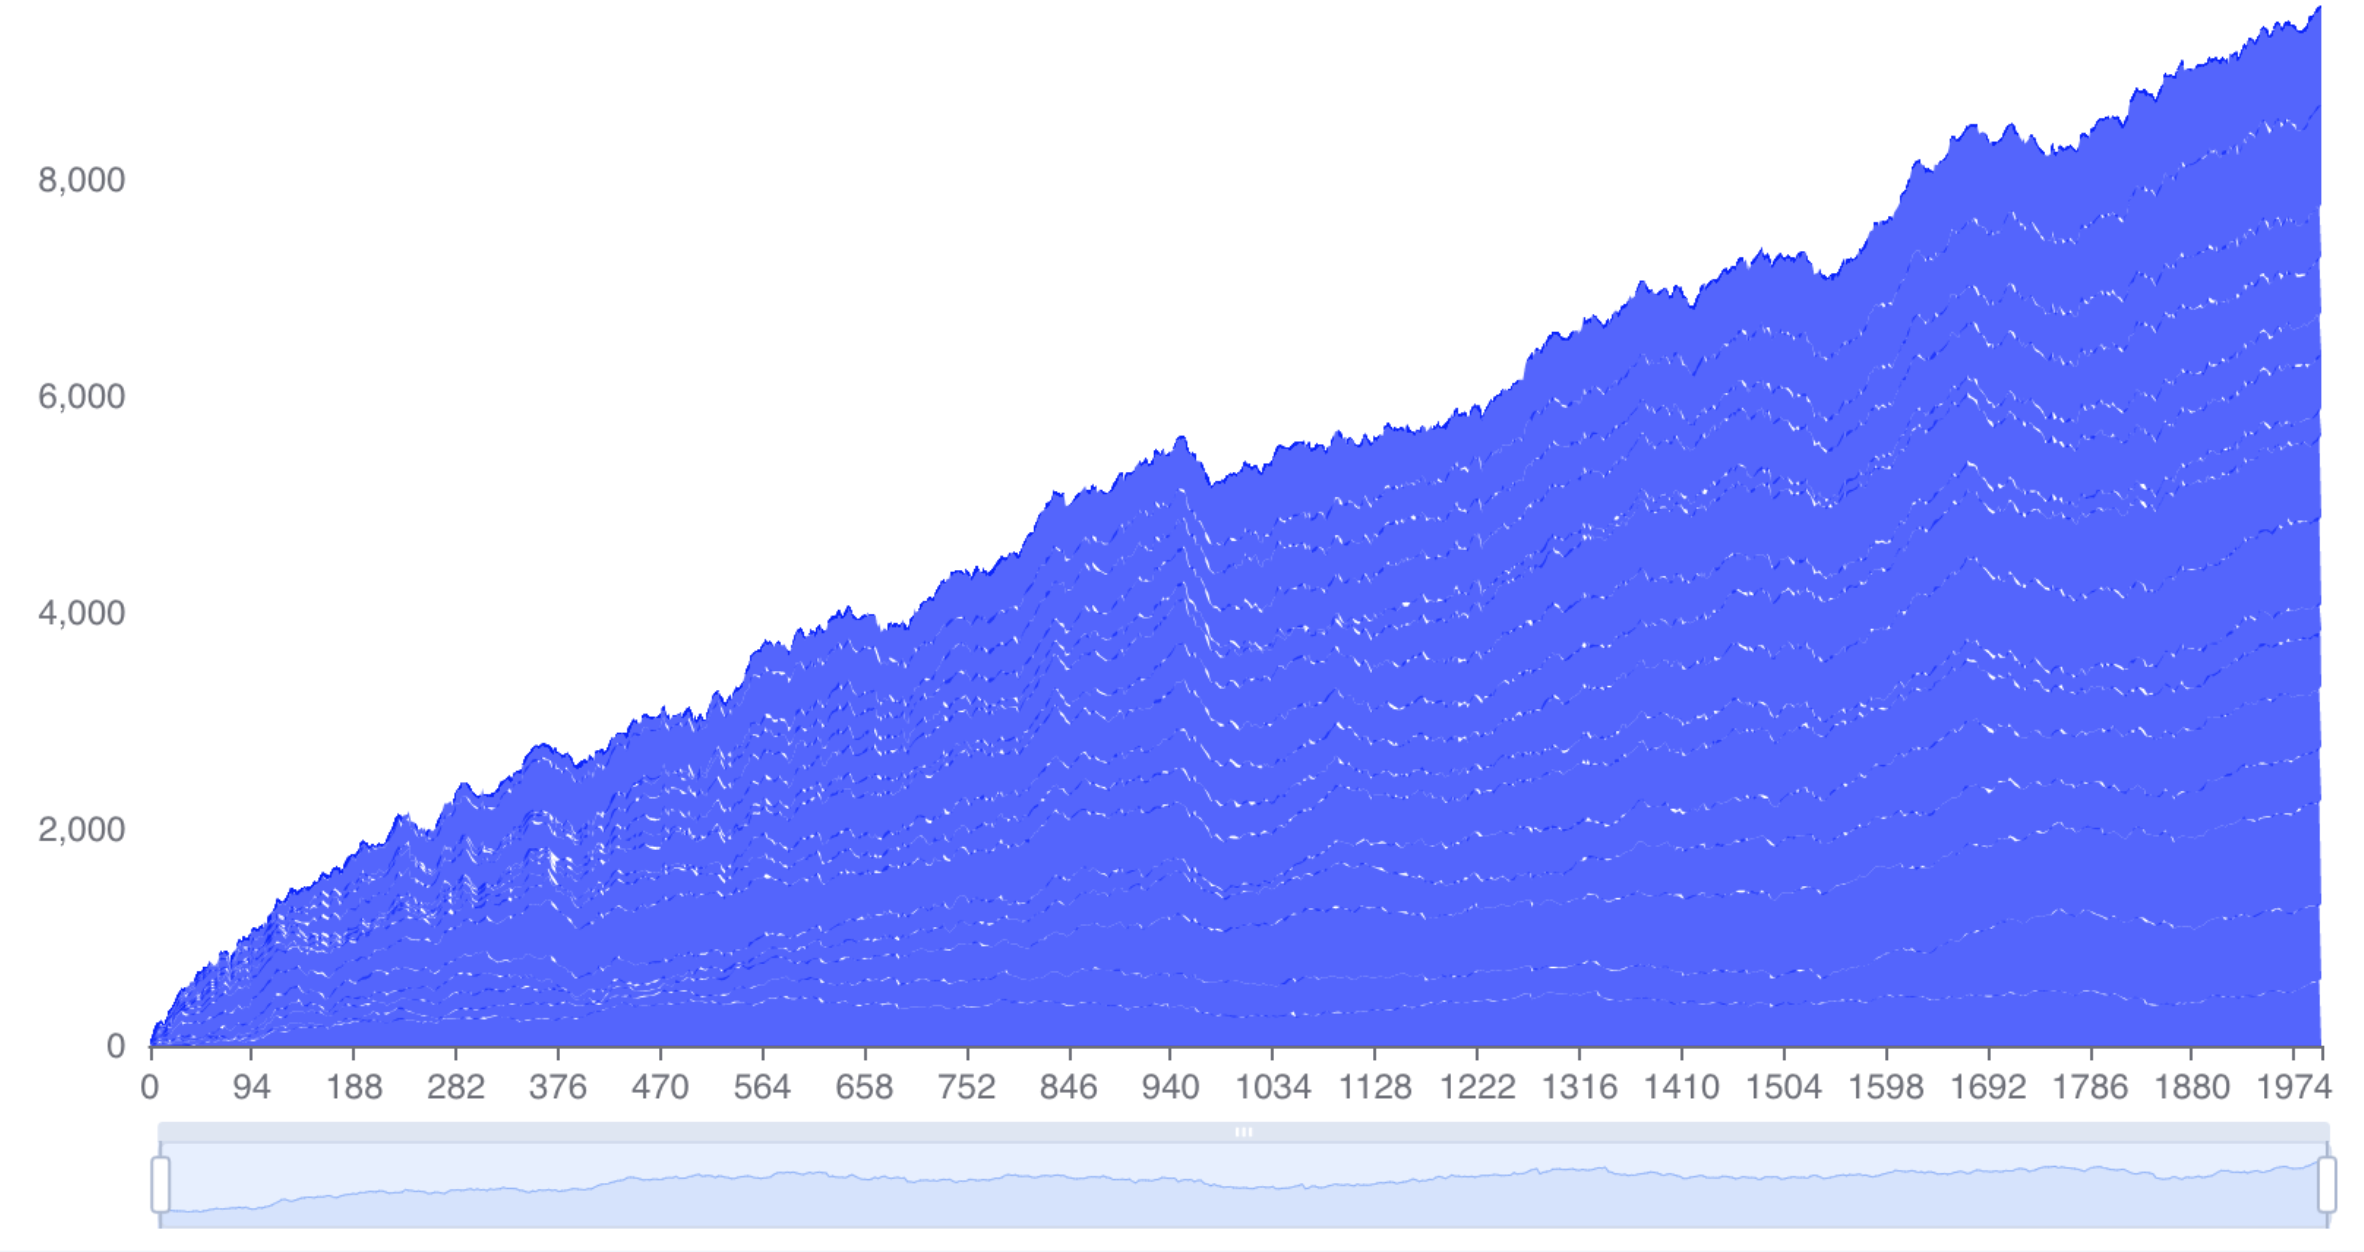
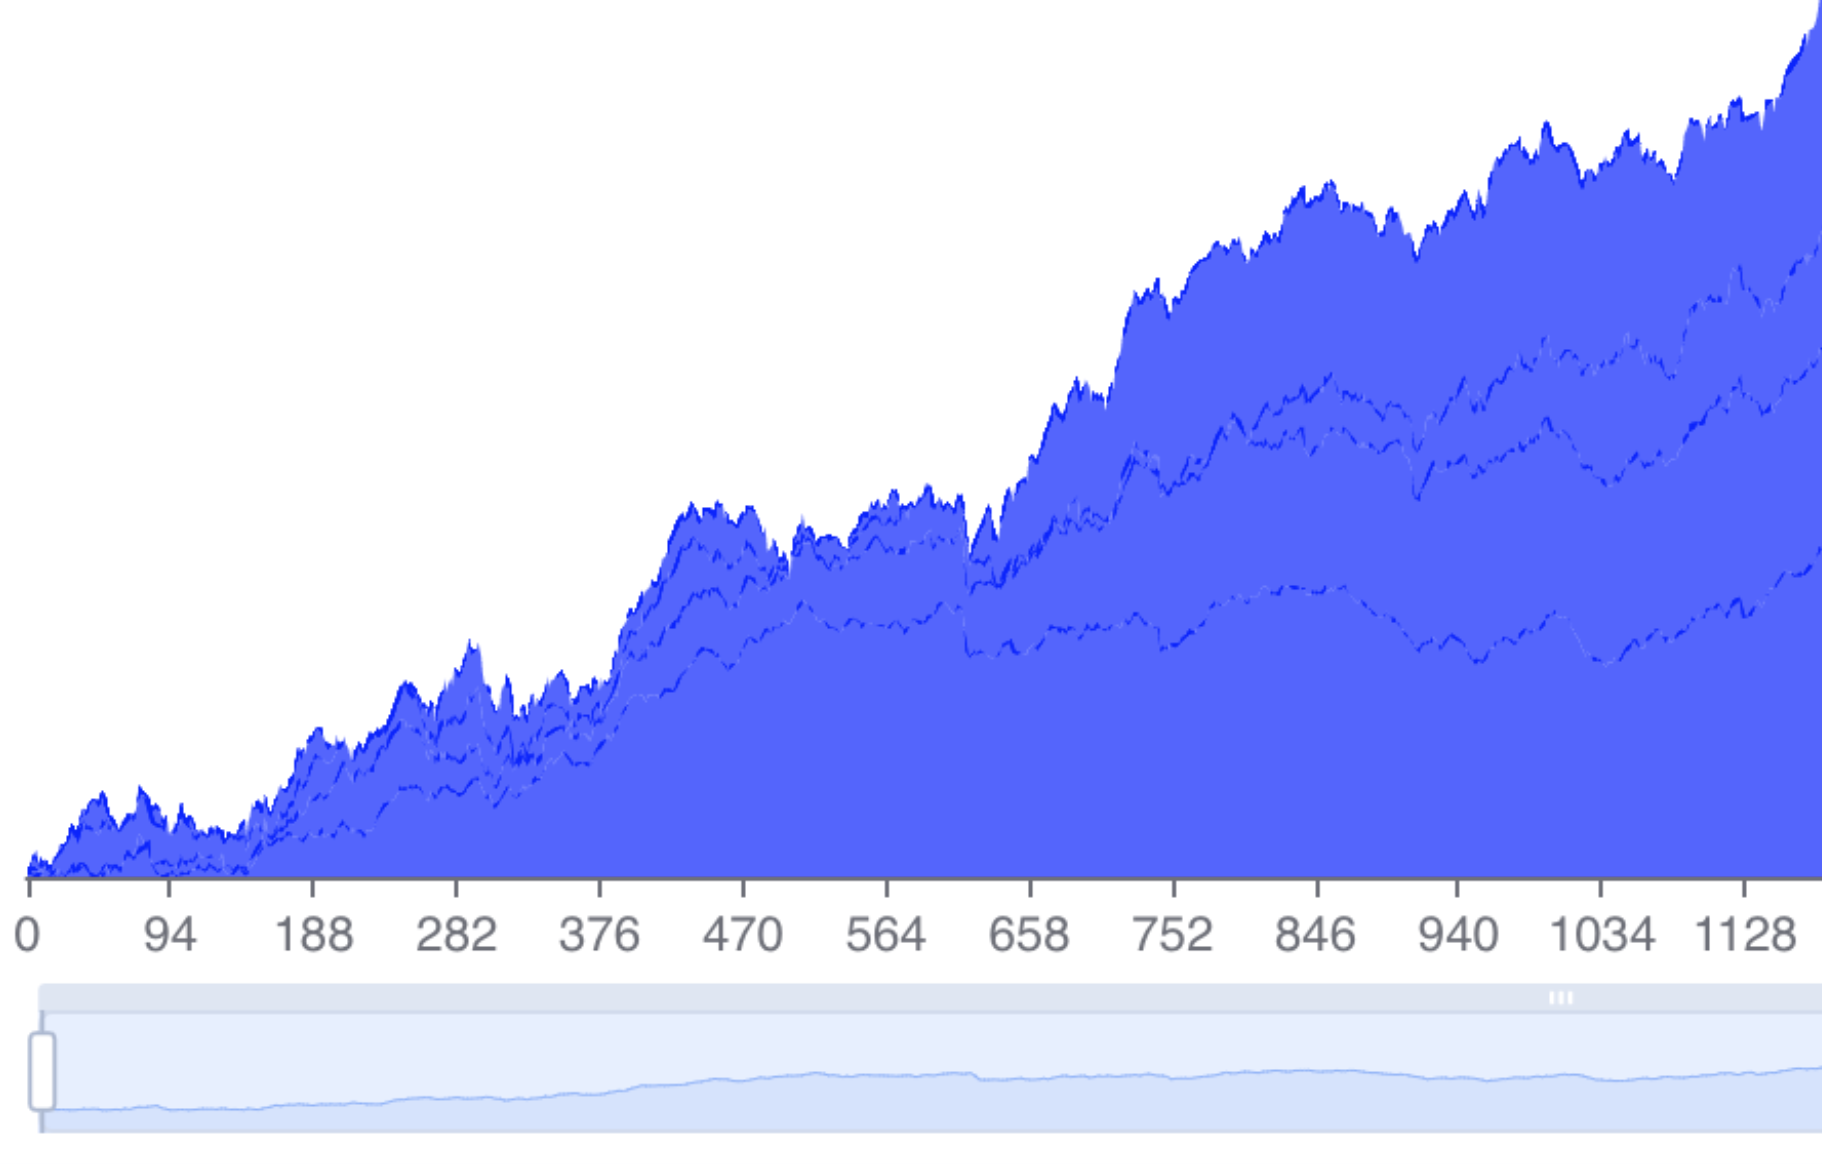
When I stack multiple line series on top of each other, you can see that they are not perfectly aligned to each other - there some gaps and overlaps on the border. Overlaps are more visible if you have some series (or some regions in those series) equal to 0.

Expected Behavior
No gaps nor overlaps in stacked area charts are visible, the series are perfectly placed on top of each other.
Environment
- OS: MacOS 10.15.7
- Browser: Chrome 99.0.4844.84
Any additional comments?
No response