Version
5.2.0
Link to Minimal Reproduction
No response
Steps to Reproduce
ec: {
onInit: function (canvas, width, height, dpr) {
chart = echarts.init(canvas, null, {
width: width,
height: height,
devicePixelRatio: dpr // new
});
canvas.setChart(chart);
            let option = {
                // color: ["rgba(242, 48, 64, 0.15)", "rgba(0, 0, 0, 0.1)"],
                xAxis: {
                    show: false
                },
                yAxis: {
                    show: false
                },
                legend: {
                    show: true,
                    right: 20,
                    itemGap: 12,
                    top: 'middle',
                    orient: "vertical",
                    // selectedMode: "single",
                    selectedMode: false,
                    itemWidth: 16,
                    itemHeight: 16,
                    icon: "path://M0,0L0,0L0,0L0,0L0,0Z M12,1.0717967748641968L16,8L12,14.928203582763672L4,14.928203582763672L0,8L4,1.0717967748641968Z",
                    textStyle: {
                        color: 'rgba(153, 80, 85, 1)',
                    }
                }
            };

            chart.setOption(option);
            return chart;
        }
    },
chart.setOption({
radar: {
radius: 68,
nameGap: 6,
splitNumber: 3,
center: ['32%', '56%'],
axisName: {
show: true,
color: "#995055",
fontWeight: 500,
formatter: (a, b) => {
i++;
console.log(data['currentValue'], i);
return [
{a|${a}},
{b|${data['currentValue'][i]}分}
].join('\n');
},
rich: {
a: {
color: "#995055",
fontWeight: 500,
fontSize: 12,
align: 'center'
},
b: {
color: "#CC999D",
fontWeight: 400,
fontSize: 9,
align: 'center',
lineHeight: 12
},
}
},
indicator: data['indicator'] || [],
axisLine: {
show: true,
lineStyle: {
color: '#F2DADC',
width: 0.5
}
},
splitLine: {
show: true,
lineStyle: {
color: ["rgba(204, 153, 157, 1)", "rgba(230, 195, 198, 1)", "rgba(230, 195, 198, 1)"],
type: "solid",
fontWeight: 500
}
},
splitArea: {
show: false
},
radarIndex: 5,
},
series: [{
name: '',
type: 'radar',
symbolSize: 4,
data: [ {
name: '本次检测',
z: 10,
colorBy: 'series',
value: data['currentValue'] || [],
areaStyle: {
color: "rgba(242, 48, 64, 0.15)",
},
itemStyle: {
color: "rgba(242, 48, 64, 1)"
},
lineStyle: {
width: 0.8,
color: "rgba(242, 48, 64, 1)"
}
},{
name: '上次检测',
z: 1,
colorBy: 'series',
value: data['lastValue'] || [],
areaStyle: {
color: "rgba(0, 0, 0, 0.1)",
},
itemStyle: {
color: "rgba(199, 199, 199, 1)",
},
lineStyle: {
width: 0.8,
color: "rgba(199, 199, 199, 1)"
}
}]
}]
});
Current Behavior
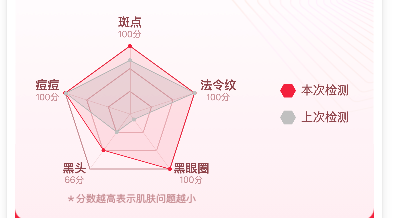
series区域的代码示例:
series: [{
name: '',
type: 'radar',
symbolSize: 4,
data: [ {
name: '本次检测',
z: 10,
colorBy: 'series',
value: data['currentValue'] || [],
areaStyle: {
color: "rgba(242, 48, 64, 0.15)",
},
itemStyle: {
color: "rgba(242, 48, 64, 1)"
},
lineStyle: {
width: 0.8,
color: "rgba(242, 48, 64, 1)"
}
},{
name: '上次检测',
z: 1,
colorBy: 'series',
value: data['lastValue'] || [],
areaStyle: {
color: "rgba(0, 0, 0, 0.1)",
},
itemStyle: {
color: "rgba(199, 199, 199, 1)",
},
lineStyle: {
width: 0.8,
color: "rgba(199, 199, 199, 1)"
}
}]
}]
Expected Behavior
目前看到的层级是根据series内数据先后顺序决定了构建区域的优先级。
希望z为10构建的图形盖在z为1构建的图形上面。
Environment
- OS:
- Browser:
- Framework:
Any additional comments?
无
Version
5.2.0
Link to Minimal Reproduction
No response
Steps to Reproduce
ec: {
onInit: function (canvas, width, height, dpr) {
chart = echarts.init(canvas, null, {
width: width,
height: height,
devicePixelRatio: dpr // new
});
canvas.setChart(chart);
chart.setOption({
radar: {
radius: 68,
nameGap: 6,
splitNumber: 3,
center: ['32%', '56%'],
axisName: {
show: true,
color: "#995055",
fontWeight: 500,
formatter: (a, b) => {
i++;
console.log(data['currentValue'], i);
return [
{a|${a}},{b|${data['currentValue'][i]}分}].join('\n');
},
rich: {
a: {
color: "#995055",
fontWeight: 500,
fontSize: 12,
align: 'center'
},
b: {
color: "#CC999D",
fontWeight: 400,
fontSize: 9,
align: 'center',
lineHeight: 12
},
}
},
indicator: data['indicator'] || [],
axisLine: {
show: true,
lineStyle: {
color: '#F2DADC',
width: 0.5
}
},
splitLine: {
show: true,
lineStyle: {
color: ["rgba(204, 153, 157, 1)", "rgba(230, 195, 198, 1)", "rgba(230, 195, 198, 1)"],
type: "solid",
fontWeight: 500
}
},
splitArea: {
show: false
},
radarIndex: 5,
},
series: [{
name: '',
type: 'radar',
symbolSize: 4,
data: [ {
name: '本次检测',
z: 10,
colorBy: 'series',
value: data['currentValue'] || [],
areaStyle: {
color: "rgba(242, 48, 64, 0.15)",
},
itemStyle: {
color: "rgba(242, 48, 64, 1)"
},
lineStyle: {
width: 0.8,
color: "rgba(242, 48, 64, 1)"
}
},{
name: '上次检测',
z: 1,
colorBy: 'series',
value: data['lastValue'] || [],
areaStyle: {
color: "rgba(0, 0, 0, 0.1)",
},
itemStyle: {
color: "rgba(199, 199, 199, 1)",
},
lineStyle: {
width: 0.8,
color: "rgba(199, 199, 199, 1)"
}
}]
}]
});
Current Behavior
series区域的代码示例:
series: [{
name: '',
type: 'radar',
symbolSize: 4,
data: [ {
name: '本次检测',
z: 10,
colorBy: 'series',
value: data['currentValue'] || [],
areaStyle: {
color: "rgba(242, 48, 64, 0.15)",
},
itemStyle: {
color: "rgba(242, 48, 64, 1)"
},
lineStyle: {
width: 0.8,
color: "rgba(242, 48, 64, 1)"
}
},{
name: '上次检测',
z: 1,
colorBy: 'series',
value: data['lastValue'] || [],
areaStyle: {
color: "rgba(0, 0, 0, 0.1)",
},
itemStyle: {
color: "rgba(199, 199, 199, 1)",
},
lineStyle: {
width: 0.8,
color: "rgba(199, 199, 199, 1)"
}
}]
}]
Expected Behavior
目前看到的层级是根据series内数据先后顺序决定了构建区域的优先级。
希望z为10构建的图形盖在z为1构建的图形上面。
Environment
Any additional comments?
无