option = {
 backgroundColor: 'white',
        color: ['#38b4ee'],
        tooltip: {
          confine: true
        },
        grid: {
          left: '5%',
          right: '22%',
          // bottom: '23%',
          width: '90%'
        },
        toolbox: {
          feature: {
            saveAsImage: {}
          }
        },
        tooltip: {
          trigger: 'axis'
        },

        xAxis: {
          // x轴
          type: 'category',
          boundaryGap: false,
          axisTick: {
            show: false
          },
          axisLine: {
            show: false
          },
          axisLabel: {
            textStyle: {
              color: 'black'
            },
            interval: 0,
            length: 1,
            showMinLabel: true,
            showMaxLabel: true
          },
          splitLine: {
            //网格线
            show: false,
            lineStyle: {
              color: ['transparent']
            }
          },
          data: ['03.02', '03.03', '03.04', '03.05', '03.06', '03.07', '03.08']
        },
        yAxis: {
          // y轴
          min: function(value) {
            return value.min - 200;
          },
          max: '4200',
          nameGap: 1,
          axisTick: {
            show: false
          },
          axisLine: {
            show: false
            //    onZero:false
          },
          axisLabel: {
            textStyle: {
              color: 'transparent'
            }
          },
          splitLine: {
            //网格线
            show: false,
            lineStyle: {
              color: ['#23303f'],
              type: 'solid'
            }
          }
        },
        series: [
          {
            name: 'movie',
            type: 'line',
            symbol: 'circle',
            smooth: false,
            symbolSize: 10,
            showSymbol: true,
            showAllSymbol: true,
            color: ['#4385F5'],
            data: ['3000', '3800', '3400', '4200', '3200', '3700', '3600'],
            label: {
              normal: {
                show: true,
                position: 'top' //值显示
              }
            }
          }
        ]
}
1:在移动端折线图最后一个数据始终显示不全。
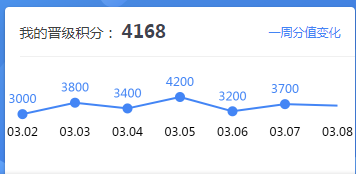
2:已经使用了showMaxLabel与守望MinLabel #
3:
Version & Environment [版本及环境]
Expected behaviour [期望结果]
可以正常显示
ECharts option [ECharts配置项]
Other comments [其他信息]