One-line summary [问题简述]
clipPaths are never cleared from pie chart elements when there is animation, potentially resulting in lingering clipPaths in <defs> that cut off part of the chart.
Version & Environment [版本及环境]
- ECharts version [ECharts 版本]: 4.1
- Browser version [浏览器类型和版本]: Chrome 68
- OS Version [操作系统类型和版本]: macOS 10.13.4
Expected behaviour [期望结果]
clipPaths are successfully cleared after animation
ECharts option [ECharts配置项]
option = {
    animation: 'auto',
    animationDuration: () => 0,
    title : {
        text: '某站点用户访问来源',
        subtext: '纯属虚构',
        x:'center'
    },
    tooltip : {
        trigger: 'item',
        formatter: "{a} <br/>{b} : {c} ({d}%)"
    },
    legend: {
        orient: 'vertical',
        left: 'left',
        data: ['直接访问','邮件营销','联盟广告','视频广告','搜索引擎']
    },
    series : [
        {
            name: '访问来源',
            type: 'pie',
            radius : '55%',
            center: ['50%', '60%'],
            data:[
                {value:335, name:'直接访问'},
                {value:310, name:'邮件营销'},
                {value:234, name:'联盟广告'},
                {value:135, name:'视频广告'},
                {value:1548, name:'搜索引擎'}
            ],
            itemStyle: {
                emphasis: {
                    shadowBlur: 10,
                    shadowOffsetX: 0,
                    shadowColor: 'rgba(0, 0, 0, 0.5)'
                }
            }
        }
    ]
};

configs = {
    renderer: 'svg'
}
Other comments [其他信息]
I've done a fair amount of investigation with this bug. It is related to resizing and the fact that clipPaths do not get removed after animations. In order to reproduce the bug in the sandbox, the following steps must be taken:
- Add the options / configs posted above. The
'svg' renderer is not necessary, but inspecting the chart is easier with SVG than canvas and it helps highlight the problem.
- Make the chart window narrow, by shrinking your browser window horizontally
- Click "Run" / make sure the chart is generated for this size screen.
- Expand the browser window open horizontally, and you can see the chart starts to get cut off on the right side.
See the attached gif for repro:
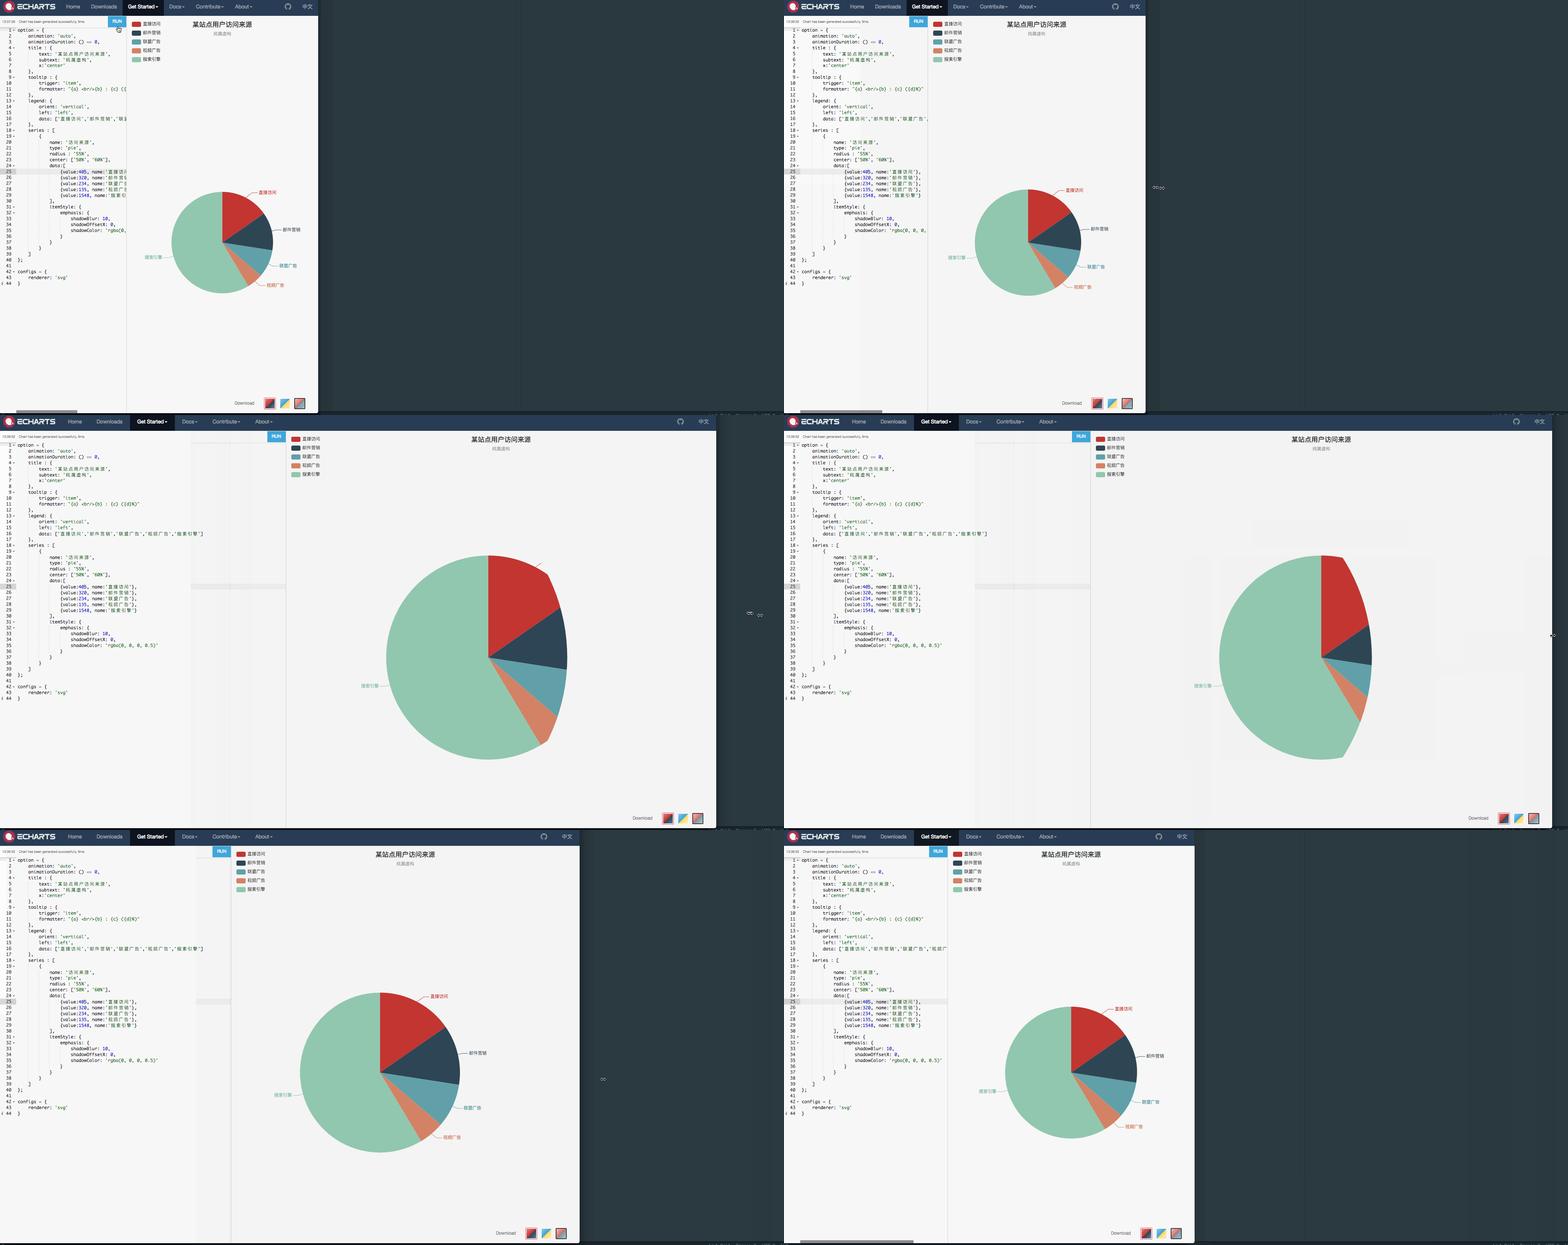
I've investigated in the source code and found that the issue is due to clipPaths not being removed after animation is complete.
See that the clipPath is set here using setClipPath, whose argument is the clipPath created with this._createClipPath(). A callback is passed into _createClipPath called removeClipPath, presumably to remove it once animation is done.
_createClipPath calls initProps, which in turn calls animateOrSetProps (this), and you can see that in this function, if animationEnabled, it eventually executes the callback (cb) to remove the clip path. The problem here is that this all is part of _createClipPath --- setClipPath has not yet actually set the clipPath on the group, so there is nothing to remove. Therefore, these clipPaths never get removed.
The residual effect of this is found in the <defs> html tag in the SVG. If you remove this (or make it display: 'none', the problem goes away:
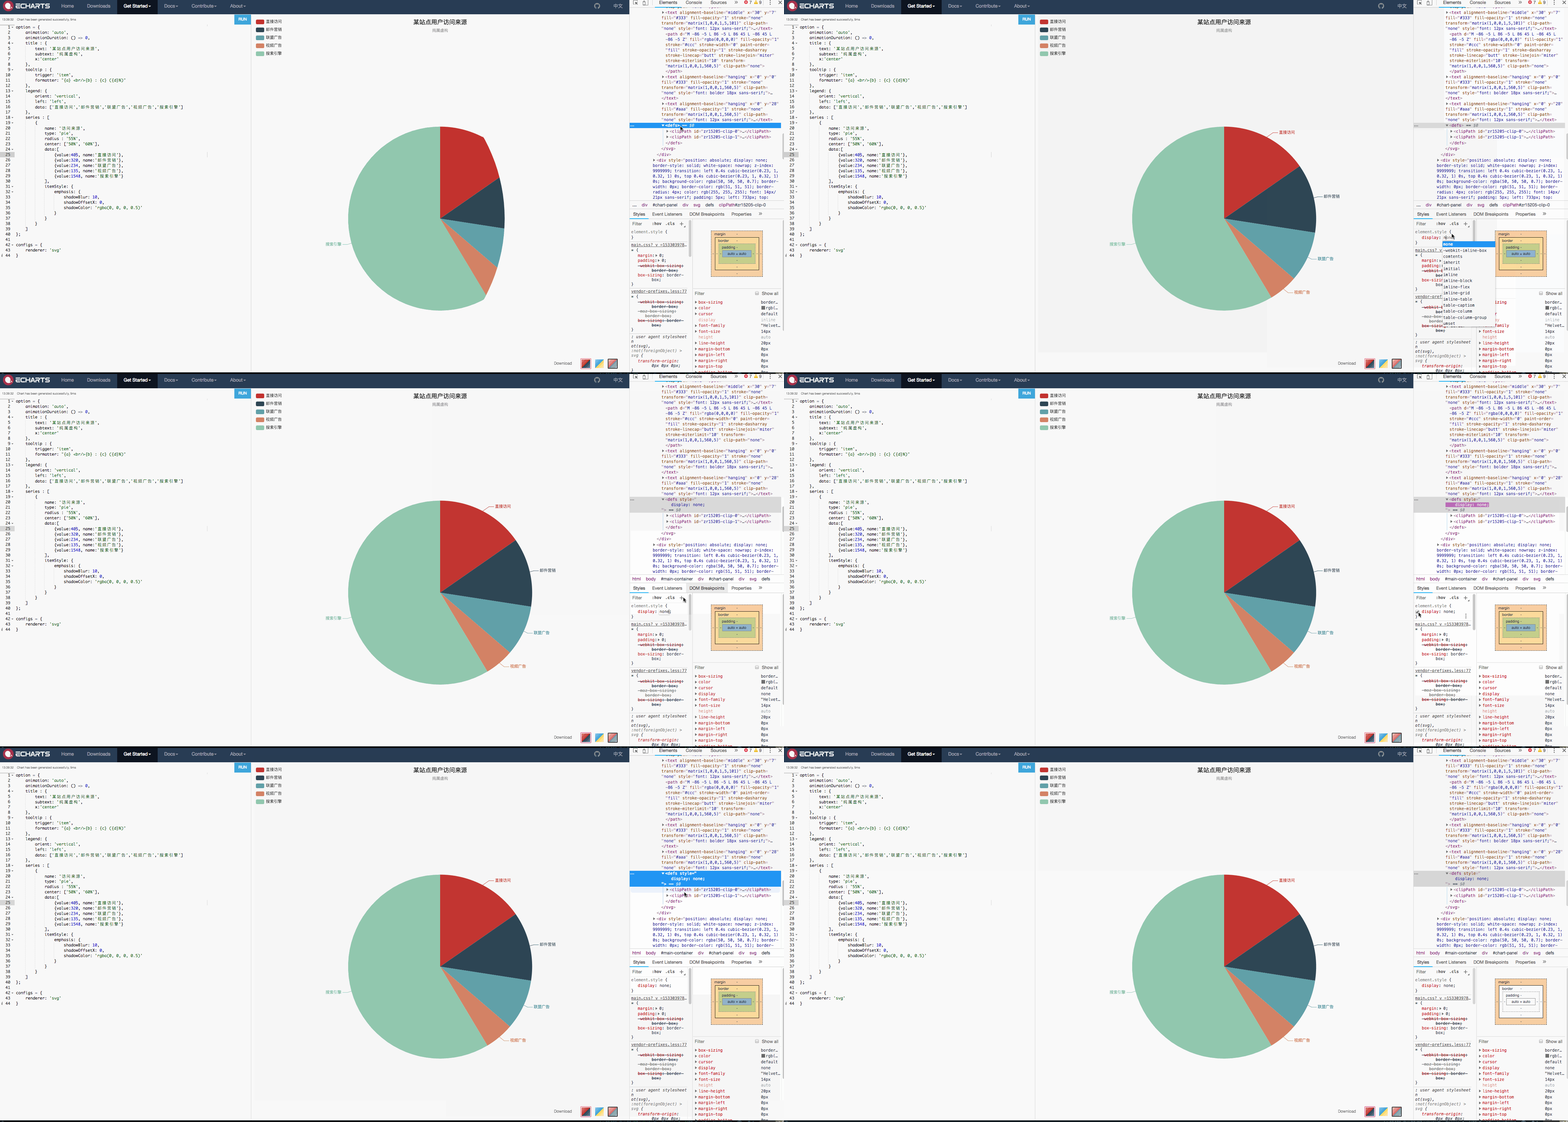
Our temporary workaround is just to hide these <defs>, because they are only supposed to be reference elements anyway. I am not sure the best way to fix the root problem in echarts. I tested by calling removeClipPath after setClipPath, which works, but I do not think it accounts for animation, so am not sure if that is the best solution.
Let me know if you have any more questions I can help answer.


One-line summary [问题简述]
clipPaths are never cleared from pie chart elements when there is animation, potentially resulting in lingeringclipPaths in<defs>that cut off part of the chart.Version & Environment [版本及环境]
Expected behaviour [期望结果]
clipPaths are successfully cleared after animationECharts option [ECharts配置项]
Other comments [其他信息]
I've done a fair amount of investigation with this bug. It is related to resizing and the fact that
clipPaths do not get removed after animations. In order to reproduce the bug in the sandbox, the following steps must be taken:'svg'renderer is not necessary, but inspecting the chart is easier with SVG than canvas and it helps highlight the problem.See the attached gif for repro:

I've investigated in the source code and found that the issue is due to
clipPaths not being removed after animation is complete.See that the
clipPathis set here usingsetClipPath, whose argument is theclipPathcreated withthis._createClipPath(). A callback is passed into_createClipPathcalledremoveClipPath, presumably to remove it once animation is done._createClipPathcallsinitProps, which in turn callsanimateOrSetProps(this), and you can see that in this function, ifanimationEnabled, it eventually executes the callback (cb) to remove the clip path. The problem here is that this all is part of_createClipPath---setClipPathhas not yet actually set the clipPath on the group, so there is nothing to remove. Therefore, theseclipPaths never get removed.The residual effect of this is found in the

<defs>html tag in the SVG. If you remove this (or make itdisplay: 'none', the problem goes away:Our temporary workaround is just to hide these
<defs>, because they are only supposed to be reference elements anyway. I am not sure the best way to fix the root problem in echarts. I tested by callingremoveClipPathaftersetClipPath, which works, but I do not think it accounts for animation, so am not sure if that is the best solution.Let me know if you have any more questions I can help answer.