option = {
     tooltip: {
                trigger: 'axis',
                axisPointer: {
                    type: 'cross'
                },
                backgroundColor: 'rgba(245, 245, 245, 0.8)',
                borderWidth: 1,
                borderColor: '#ccc',
                padding: 10,
                textStyle: {
                    color: '#000'
                }
            },
            axisPointer: {
                link: { xAxisIndex: 'all' },
                label: {
                    backgroundColor: '#777'
                }
            },
    grid: [{
                    left: '3%',
                    right: '4%',
                    bottom: 30,
                    height: 90
                }, {
                    left: '3%',
                    right: '4%',
                    bottom: 150,
                    height: 90
                }, {
                    left: '3%',
                    right: '4%',
                    bottom: 270,
                    height: 90
                }, {
                    left: '3%',
                    right: '4%',
                    bottom: 410,
                    height: 90
                }, {
                    left: '3%',
                    right: '4%',
                    bottom: 530,
                    height: 90
                }],
   xAxis: [{
                    type: 'category',
                    boundaryGap: false,
                    data: ['一', '二', '三', '四', '五', '六', '日']
                }, {
                    type: 'category',
                    boundaryGap: false,
                    data: ['一', '二', '三', '四', '五', '六', '日'],
                    gridIndex: 1
                }, {
                    type: 'category',
                    boundaryGap: false,
                    data: ['一', '二', '三', '四', '五', '六', '日'],
                    gridIndex: 2
                }, {
                    type: 'category',
                    boundaryGap: false,
                    data: ['一', '二', '三', '四', '五', '六', '日'],
                    gridIndex: 3
                },
                {
                    type: 'category',
                    boundaryGap: false,
                    data: ['一', '二', '三', '四', '五', '六', '日'],
                    gridIndex: 4
                }],
    yAxis: [{
                    type: 'value',
                    axisTick: {
                        show: false
                    },
                    splitLine: {
                        show: false
                    },
                    interval: 10000
                }, {
                    type: 'value',
                    gridIndex: 1,
                    axisTick: {
                        show: false
                    },
                    splitLine: {
                        show: false
                    },
                    interval: 10000
                }, {
                    type: 'value',
                    gridIndex: 2,
                    axisTick: {
                        show: false
                    },
                    splitLine: {
                        show: false
                    },
                    interval: 10000
                }, {
                    type: 'value',
                    gridIndex: 3,
                    axisTick: {
                        show: false
                    },
                    splitLine: {
                        show: false
                    },
                    interval: 10000
                }, {
                    type: 'value',
                    gridIndex: 4,
                    axisTick: {
                        show: false
                    },
                    splitLine: {
                        show: false
                    },
                    interval: 10000
                }],
   series: [
                    {
                        name: 'mail',
                        type: 'line',
                        data: [10, 80, 40, 60, 30, 50, 70],
                        xAxisIndex: 0,
                        yAxisIndex: 0
                    },
                    {
                        name: 'ad',
                        type: 'line',
                        data: [80, 40, 60, 30, 50, 70, 10],
                        xAxisIndex: 1,
                        yAxisIndex: 1
                    },
                    {
                        name: 'vadio',
                        type: 'line',
                        data: [40, 60, 30, 50, 70, 10, 80],
                        xAxisIndex: 2,
                        yAxisIndex: 2
                    },
                    {
                        name: '访问',
                        type: 'line',
                        data: [60, 30, 50, 70, 10, 80, 40],
                        xAxisIndex: 3,
                        yAxisIndex: 3
                    },
                    {
                        name: 'search',
                        type: 'line',
                        data: [30, 50, 70, 10, 80, 40, 60],
                        xAxisIndex: 4,
                        yAxisIndex: 4
                    }
                ]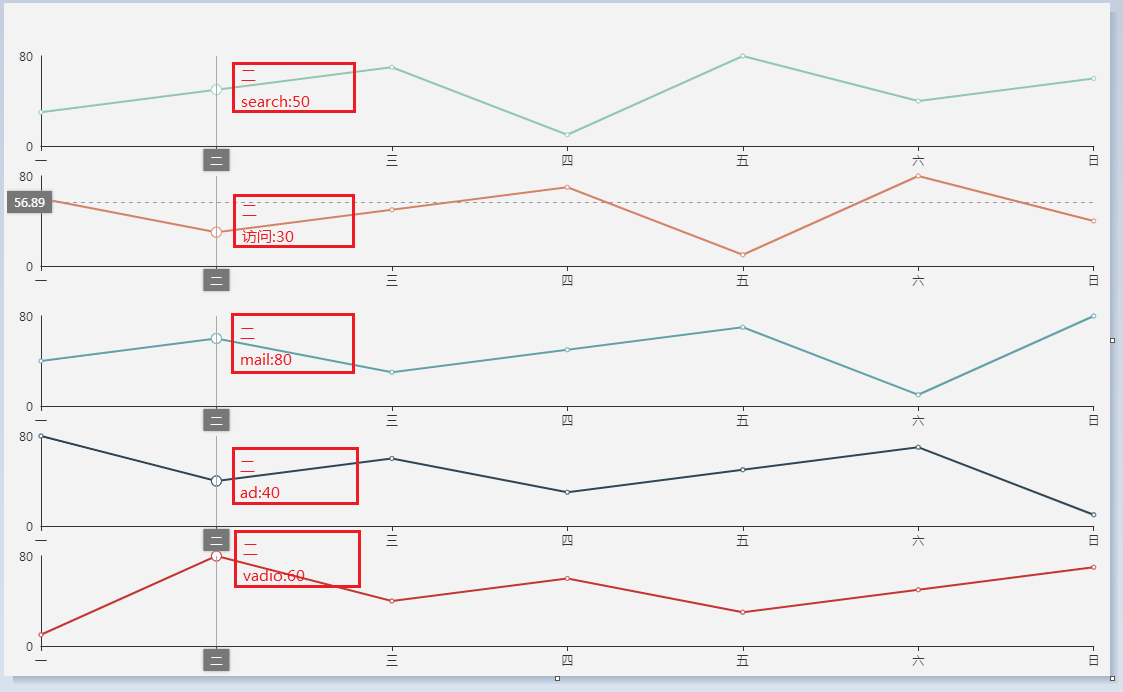
};描述:上图的chart由多个grid的组成,图中纵坐标等于为'二'处有一条贯穿所有grid的Y线,Y线与grid中的数据交叉时,会出现tooltip,tooltip中显示Y线与所有grid的相交点数据.
问题:我想要实现如下效果,当贯穿线Y线与所有grid的数据相交时,每个相交点右侧有属于自己独有的tooltip,在属于每个交点自己独有的tooltip中,只显示Y线与自己的交点的数据.(具体效果如下图)_
代码:
_你好,如上图:
描述:上图的chart由多个grid的组成,图中纵坐标等于为'二'处有一条贯穿所有grid的Y线,Y线与grid中的数据交叉时,会出现tooltip,tooltip中显示Y线与所有grid的相交点数据.
问题:我想要实现如下效果,当贯穿线Y线与所有grid的数据相交时,每个相交点右侧有属于自己独有的tooltip,在属于每个交点自己独有的tooltip中,只显示Y线与自己的交点的数据.(具体效果如下图)_
