- To know the grand total per month and in each year.
- To know the grand total per month in each year and month with the highest and lowest grand total in each year.
- To know the comparison of the grand total between each year and find month with the most significant decrease and increase in each year.
- To get customer segmentation using RFM model.
- To know how to optimize marketing strategies to the right customers to generate more revenue.
- Large size of dataset
- Dataset have different data types.
- Transactional Data
- Exploratory analysis (Graph Analysis)
- Clustering Model
- Segment Analysis using RFM
- Know how to treat customers with specific criteria.
- Increase business revenue.
- Marketing Strategy Right on Target
- Know the grand total in each year
- Know the grand total per month in each year and month with the highest and lowest grand total in each year.
- Know the comparison of the grand total between each year and know month with the most significant decrease and increase in each year.
- Get customer segmentation using RFM model.
- Know how to optimize marketing strategies to the right customers to generate more revenue.
Retail is the process of selling consumer goods or services to customers through multiple channels of distribution to earn a profit.
This case requires data-driven answers to the following questions:
- How much is the grand total in each year?
- How much is the grand total per month in each year and which month has the highest and lowest grand total in each year?
- How is the comparison of the grand total between each year and which month has the most significant decrease and increase in each year?
- How is the customer segmentation using RFM model?
- How to optimize marketing strategies to the right customers to generate more revenue?
- Data of a retail transaction from 04 January 2011 to 31 December 2014
- The dataset has 4 columns and 5009 rows.
- Order Date : Transaction date
- Order Id : Order code of each transaction
- Customer : Customer's name
- Grand Total : Total customer spending
Code Used :
- Python Version :Python 3.8.8
- Packages : Pandas, Numpy, Matplotlib, Seaborn, Datetime, Warnings.
- The order_date data type which is an object is wrong because the column value is a transaction date which should be a datetime data type, so we need to change the order_date data type from the object to datetime.
- Create a new column that takes only the year and month from the order_date column.
How much is the grand total per month in each year and which month has the highest and lowest grand total in each year?
-
2011
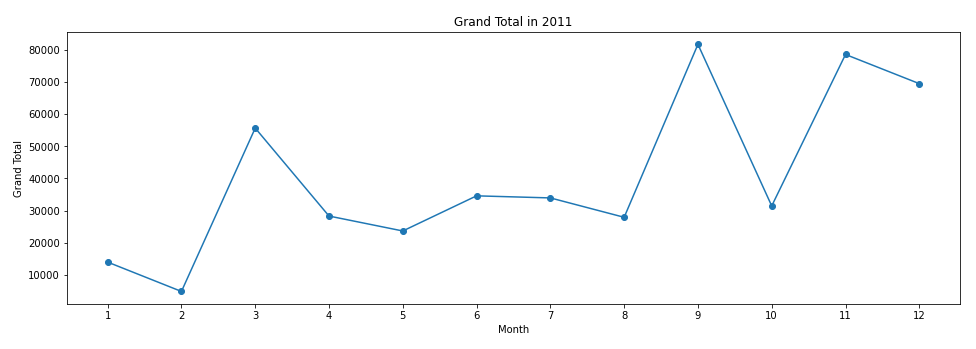 Based on the graph above, February is the month with the lowest total sales of 1%, while September is the month with the highest total sales of 16.9%. From January to February it decreased by 1.9%, then from February to March it experienced a significant increase of 10.5%, then from March to April it decreased by 5.7%. And from April to August there was no significant increase, then from August to September there was an increase of 11.1%, but from September to October there was a very large decrease up to 10%, then from October to November increased by 9.7%. and closed at the end of the year in November with a percentage of 14.4% of total revenue in each month.
 -
2012
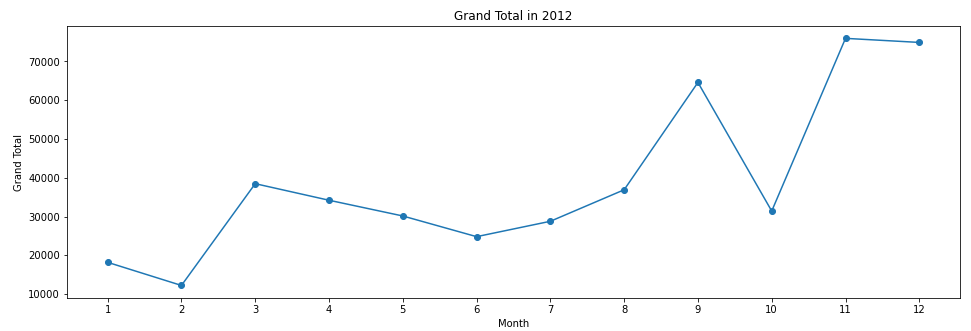 Based on the graph above, February is the month with the lowest grand total of 2.6%, while November is the month with the highest grand total of 16.1%. The grand total in January 2012 was higher than in January 2011 to 3.9%, then in February it decreased to 2.6%. In March it experienced a significant increase to 8.2% and in April it decreased slightly to 7.3%. Furthermore, in May it decreased to 6.4% and in June also decreased to 5.3% before in July it increased again to 6.1%. In August the grand total increased to 7.8% and in September it increased significantly to 13.7%, then in October it decreased significantly to 6.7%. The end of the year had a very high grand total, November was 16.1% and December slightly decreased to 15.9%.
 -
2013
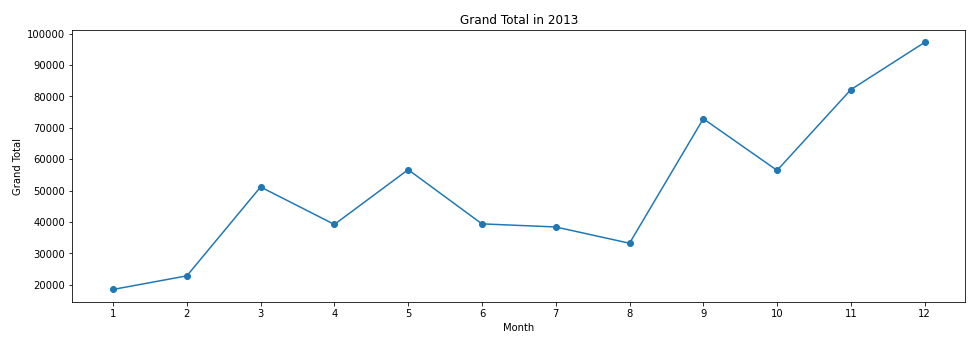 Based on the graph above, January is the month with the lowest grand total of 3%, while December is the month with the highest grand total of 16%. 2013 started with a relatively low grand total, amounting to only 3% in January, then in February it increased to 3.8% and in March it increased to 8.4%. In April it decreased to 6.5% and in March it increased again to 9.3%. It then fell in June to 6.5%. The highest grand total in the first half was in May with a percentage of 9.3%. Entering the second half of 2013, the grand total for July and August did not differ significantly, in July it was 6.3% and in August it was 5.5%. In the following month or September, there was a significant increase in the grand total of up to 12%. sales tend to increase at the end of the year, in November by 14% and in December by 16%.
 -
2014
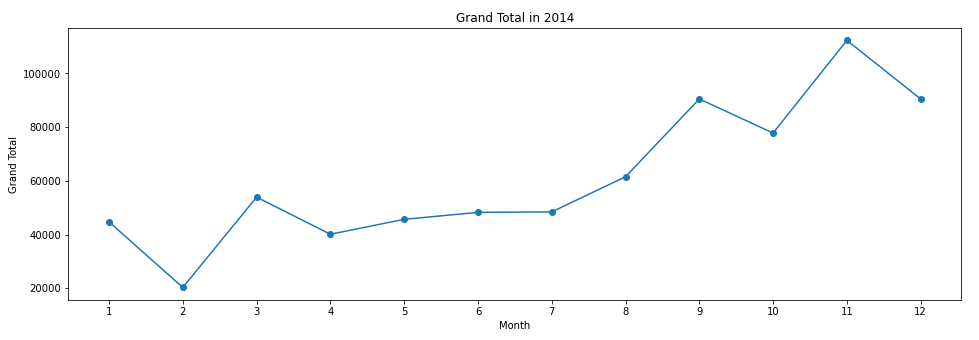 Based on the graph above, February is the month with the lowest grand total of 2.8%, while November is the month with the highest grand total of 15.3%. The grand total in January this year was not as low as the previous year at 6.1% and then decreased to 2.8% and in March rose significantly to 7.3%. Three months later, the grand total went up gradually. The grand total in April was 5.5%, in May it increased by 6.2%, in June it increased by 6.6%. The grand total was stagnant from June to July, both at 6.6%. Then in August it increased to 8.4%, in September it increased to 12.3% before decreasing in October to 10.6%. After that, the grand total in November increased to 15.3% and in December decreased again to 12.3%.
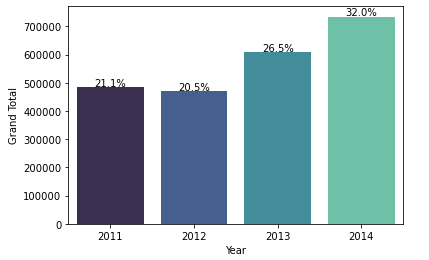 In the chart above shows the grand total by year, we can conclude that the lowest grand total was in 2012 at 20.5%, while the highest grand total was in 2014 at 32%. Although there was a decrease in total sales in 2012 from 0.6% in 2011, but in 2013 and 2014 there was an increase. It can be seen starting from 2011 with a grand total of 21%. In 2012 total sales decreased by 0.6% so that total sales were 20%, in 2013 the grand total here increased by 5.1% so that total sales were 26.5%, while in 2014 it increased by 5.5% so that total sales were by 32%.
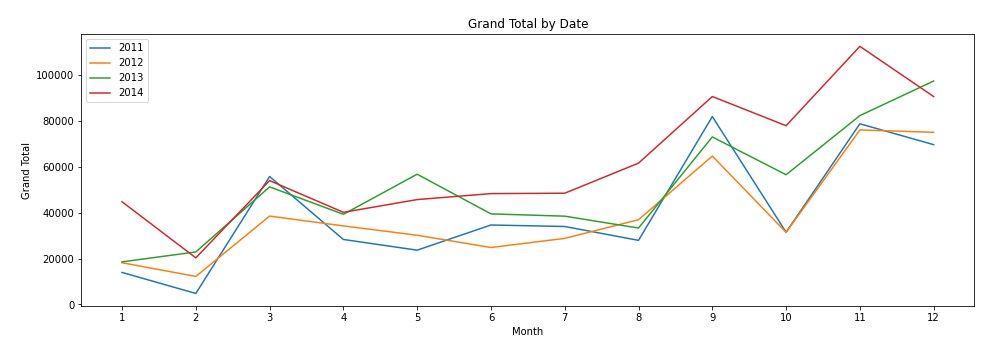 The graph above shows that in 2014 almost dominated the highest total income each month. In addition, there are several patterns of total monthly income in each year that have similarities in certain months, for example, from February to March there is an increase in total income, then from August to September there is also an increase but from September to October there is decrease every year. In October to November experienced an increase in income. It is estimated that the increase in grand total in November is due to the Black Friday event which is held every year. But the green line or 2013 is slightly different from other years at the beginning and end of the year, if you look closely, only 2013 experienced an increase in income from January to February, and at the end of the year only 2013 experienced an increase in income from October to the end of December.
RFM analysis is basically scoring our customers based on their Recency, Frequency and Monetary values.
Recency : How long it’s been since a customer bought something from us.
Frequency : How often a customer buys from us.
Monetary : The total value of purchases a customer has made
To score each column of Recency, Frequency and Monetary, we determine a score range from numbers 1 to 4, where the highest score is 1 and the lowest score is 4. For example:
If Recency has a score of 1, the customer has just made a transaction, and if the recency has a score of 4, the customer has not made a transaction for a long time.
On Frequency if it has a score of 1, the customer makes transactions more often, and if Frequency has a score of 4, the customer makes transactions less and less.
In Monetary, if it has a score of 1, the total expenses incurred by the customer will be greater, and if the Monetary has a score of 4, the total expenses incurred by the customer will be smaller.
Based on the RFM data the customer is labeled into 6 parts. for details:
- If the RFM_Segment is 111 then the customer labeled as Best Customers.
- If the F_quartile is 1 then the customer labeled as Loyal Customers.
- If the M_quartile is 1 then the customer labeled as Big Spenders.
- If the RFM_Segment is 134 then the customer labeled as Almost Lost.
- If the RFM_Segment is 344 then the customer labeled as Lost Customers.
- If the RFM_Segment is 444 then the customer labeled as Lost Cheap Customers.
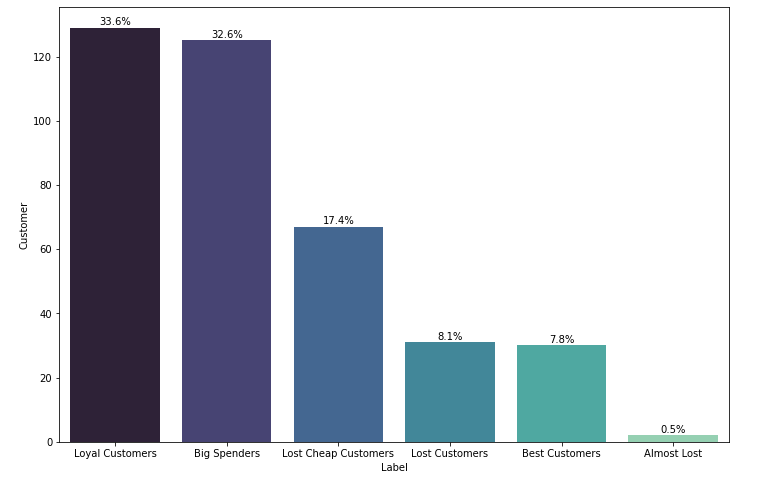 The chart above shows the results of customer clustering that are labeled and included in certain categories. After modeling using RFM analysis, customers were found in several categories, there are Loyal Customers with 33.6% with the criteria of frequent purchases, Big Spenders with 32.6% with the criteria of having a large monetary value, Lost Cheap Customers with 17.4% or customers who can be said to be almost churn with the criteria that they have not made purchases for too long, rarely making a purchase, and not having a large monetary value, Lost Customers with 8.1% or a customer who can be said to be churn with the criteria of having not made a purchase for a long time, rarely making a purchase, and not having a large monetary value, Best Customers with 7.8% with the criteria of having just made a purchase, making frequent purchases, and having a large monetary value, and Almost Lost with 0.5% with the criteria of recently making a purchase, making purchases quite often, and having a low monetary value. There are 52% of customers that do not fit into a category labeled with Others.
-
In 2011, February is the month with the lowest total sales of 1%, while September is the month with the highest total sales of 16.9%. From January to February it decreased by 1.9%, then from February to March it experienced a significant increase of 10.5%, then from March to April it decreased by 5.7%. And from April to August there was no significant increase, then from August to September there was an increase of 11.1%, but from September to October there was a very large decrease up to 10%, then from October to November increased by 9.7%. and closed at the end of the year in November with a percentage of 14.4% of total revenue in each month. September was the month that experienced the biggest increase in the grand total of 11.1% compared to other months, from 5.8% in August to 16.9% in September. Meanwhile, October was the month that experienced the biggest decreased in the grand total of 10.4% compared to other months, from 16.9% in September to 6.5% in October.
-
In 2012, Based on the graph above, February is the month with the lowest grand total of 2.6%, while November is the month with the highest grand total of 16.1%. The grand total in January 2012 was higher than in January 2011 to 3.9%, then in February it decreased to 2.6%. In March it experienced a significant increase to 8.2% and in April it decreased slightly to 7.3%. Furthermore, in May it decreased to 6.4% and in June also decreased to 5.3% before in July it increased again to 6.1%. In August the grand total increased to 7.8% and in September it increased significantly to 13.7%, then in October it decreased significantly to 6.7%. The end of the year had a very high grand total, November was 16.1% and December slightly decreased to 15.9%. October was the month that experienced the biggest increase in the grand total of 9.4% compared to other months, from 6.7% in September to 16.1% in October. Meanwhile, October was the month that experienced the biggest decreased in the grand total of 7% compared to other months, from 13.7% in September to 6.7% in October.
-
In 2013, January is the month with the lowest grand total of 3%, while December is the month with the highest grand total of 16%. 2013 started with a relatively low grand total, amounting to only 3% in January, then in February it increased to 3.8% and in March it increased to 8.4%. In April it decreased to 6.5% and in March it increased again to 9.3%. It then fell in June to 6.5%. The highest grand total in the first half was in May with a percentage of 9.3%. Entering the second half of 2013, the grand total for July and August did not differ significantly, in July it was 6.3% and in August it was 5.5%. In the following month or September, there was a significant increase in the grand total of up to 12%. sales tend to increase at the end of the year, in November by 14% and in December by 16%. September was the month that experienced the biggest increase in the grand total of 6.5% compared to other months, from 5.5% in August to 12% in September. Meanwhile, June was the month that experienced the biggest decreased in the grand total of 2.8% compared to other months, from 9.3% in May to 6.5% in June.
-
In 2014, February is the month with the lowest grand total of 2.8%, while November is the month with the highest grand total of 15.3%. The grand total in January this year was not as low as the previous year at 6.1% and then decreased to 2.8% and in March rose significantly to 7.3%. Three months later, the grand total went up gradually. The grand total in April was 5.5%, in May it increased by 6.2%, in June it increased by 6.6%. The grand total was stagnant from June to July, both at 6.6%. Then in August it increased to 8.4%, in September it increased to 12.3% before decreasing in October to 10.6%. After that, the grand total in November increased to 15.3% and in December decreased again to 12.3%. November was the month that experienced the largest increase in grand total of 4.7% compared to other months in 2014, from 10.6% in October to 15.3% in November. Meanwhile, February was the month that experienced the biggest decreased in the grand total of 3.3% compared to other months, from 6.1% in January to 2.8% in February.
-
2014 almost dominated the highest total income each month. In addition, there are several patterns of total monthly income in each year that have similarities in certain months, for example, from February to March there is an increase in total income, then from August to September there is also an increase but from September to October there is decrease every year. In October to November experienced an increase in income. It is estimated that the increase in grand total in November is due to the Black Friday event which is held every year. But the green line or 2013 is slightly different from other years at the beginning and end of the year, if you look closely, only 2013 experienced an increase in income from January to February, and at the end of the year only 2013 experienced an increase in income from October to the end of December.
-
In the chart above shows the grand total by year, we can conclude that the lowest grand total was in 2012 at 20.5%, while the highest grand total was in 2014 at 32%. Although there was a decrease in total sales in 2012 from 0.6% in 2011, but in 2013 and 2014 there was an increase. It can be seen starting from 2011 with a grand total of 21%. In 2012 total sales decreased by 0.6% so that total sales were 20%, in 2013 the grand total here increased by 5.1% so that total sales were 26.5%, while in 2014 it increased by 5.5% so that total sales were by 32%.
-
After modeling using RFM analysis, customers were found in several categories, there are Loyal Customers with 33.6% with the criteria of frequent purchases, Big Spenders with 32.6% with the criteria of having a large monetary value, Lost Cheap Customers with 17.4% or customers who can be said to be almost churn with the criteria that they have not made purchases for too long, rarely making a purchase, and not having a large monetary value, Lost Customers with 8.1% or a customer who can be said to be churn with the criteria of having not made a purchase for a long time, rarely making a purchase, and not having a large monetary value, Best Customers with 7.8% with the criteria of having just made a purchase, making frequent purchases, and having a large monetary value, and Almost Lost with 0.5% with the criteria of recently making a purchase, making purchases quite often, and having a low monetary value. There are 52% of customers that do not fit into a category labeled with Others.
-
Given the black friday in November, Christmas eve and New year's eve in december, the business team needs to optimize sales so that business revenue is even greater. In addition, given the decline in sales that occur every year in January and February, the business team needs to develop ideas so that the business can get a low income.
-
The distribution of customer types is more Loyal Customers as much as 33.6% and Big Spenders as much as 32.6%, therefore customers with these criteria need to be pampered to stay loyal and willing to spend a lot of money to shop, for example by encouraging Loyal Customers to spread the love with referral programs and send personalized product updates for Big Spenders customers.
-
A small number of customer types can be considered churn, therefore it is necessary to develop ways to activate customers and make these customers feel at home to shop again, for example by setting how long after a user's last activity date we would like to automatically send a reward for Lost Customers or customers who have already churn and sent invitations to the Almost Lost customers to Loyalty Program.
-
The spread of Best Customers is only 7.8%, there needs to be a way for these customers to remain loyal and try to include customers in the Loyal Customers and Big Spender categories to become best customers. In addition, to listen to feedback from them is also important.