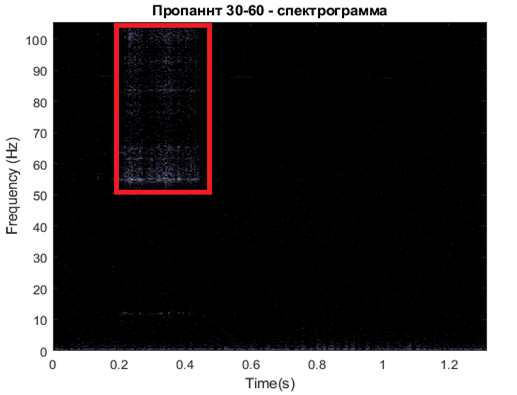
Find sand segments on spectrogram use object detection mechanism.
This project is dedicated to the detection of areas on spectrograms where sand is contained in the gas flow on the acoustic signals received from the well. These areas correspond to rectangles in the high-frequency region on the spectrogram (over 50 kHz). If such areas are selected automatically, then it is possible to more efficiently collect a database for training machine learning algorithms that will be used in real time.
I annotated the data with LabelImg (https://github.com/tzutalin/labelImg) .(It is a graphical image annotation tool, which is written in Python and uses Qt for its graphical interface. Annotations are saved as XML files in PASCAL VOC format, the format used by ImageNet.Besides, it also supports YOLO format).
Xml_to_csv.py helps convert XML rectangle data in CSV and then it possible to process these data using pandas.
Sand_detection.ipynb contains notebook, which wrtiten in Google Colab (This allows you to use the free GPU that Google provides).I've used torchvision’s FasterRCNN with a resnet50 backbone.