This code demonstrates the basics of machine learning by implementing algorithms for linear regression of multiple variables. Given a training set of data with any number of features, it can learn parameters that fit an optimal linear function to the data and make predictions. While this code can work for any number of variables, linear regression is best used when there are only a few features because the data can be easily plotted, and because neural networks are better "in general" for data sets with a high number of features.
Steps to implement linear regression using this code:
- Obtain raw initial data from somewhere and put it into a csv file.
- Modify the data by adding the x_0 feature. Also, feature normalize the data if necessary. Note that this code separates the initial X and feature normalized X into two distinct variables.
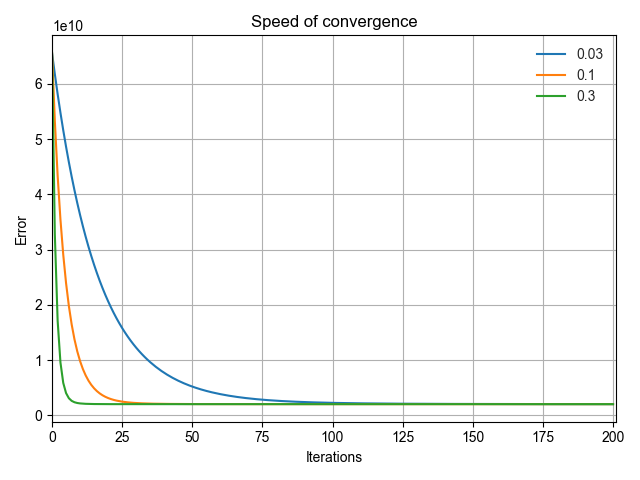
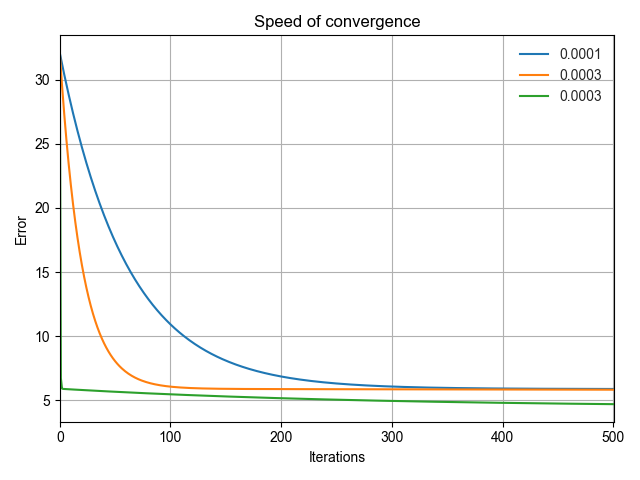
- Choose a learning rate by plotting the speed of convergence of the error function with respect to the number of iterations.
- Depending on the situation, apply a gradient descent algorithm to return the optimal parameters that minimizes the error function.
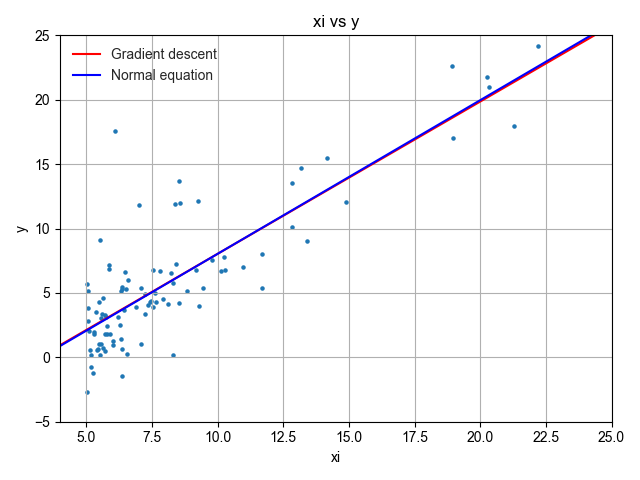
- Plot linear regression using the optimal parameters.
Reference
- xj_i is the ith element of the jth training example
- Training examples range from x1 to xm
- Each training example has elements ranging from x_0 to x_n+1
- Use numpy 2d arrays as preferred data structure whenever possible
- If learning rates are too large, J can diverge and blow up, resulting in really large values the computer cannot comprehend
- Csv files MUST include headers (x_0, x_1, ..., y) or else the first training ex will be cut off
Data
- Data Set 1: linReg1.csv, do not do feat norm
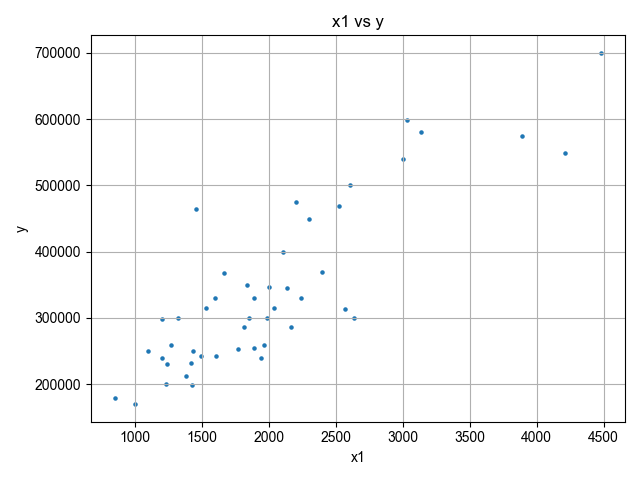
- Data Set 2: linReg2.csv, requires feat norm
Examples
Testing different learning rates for data set 1
Plotting linear functions to predict data set 1 using the learned parameters
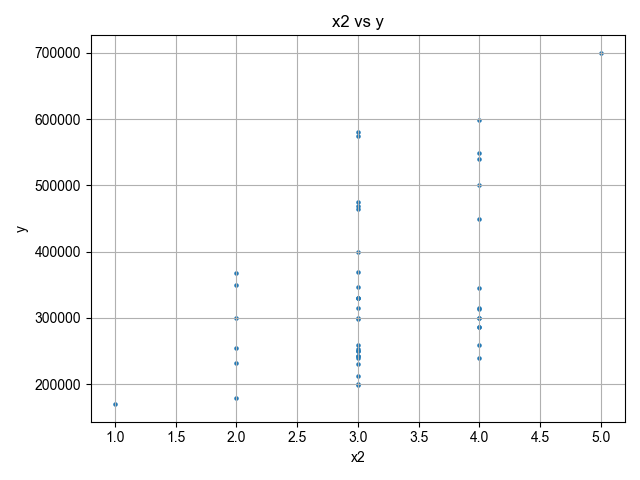
Visualizing data set 2
Testing different learning rates for data set 2