Predicting daily stock market movement with machine learning
Table of Contents
- Overview
- Scoring
- Data
- Exploratory data analysis and visualization
- Modeling of investment strategies
- Evaluation
Overview
The purpose of this project is to create a daily stock direction prediction tool. I’ll be working with Tesla (TSLA) stock market data but ideally the techniques can be applied broadly. Investment strategies focused on classification, including machine learning algorithms, will make buy (1) and sell (0) predictions of the stock before the trading day begins. Specifically, a buy (1) prediction indicates the sign of the return (i.e., daily percent change) will be positive for the predicted day, while the sell (0) prediction indicates the sign of the return will be negative. The presentation covers the final notebook and detailed notebooks are located in weekly folders.
Scoring
Scoring is focused on financial performance and accuracy score during the test data timeframe (1/3/23 – 4/19/23).
- Financial performance reflects the difference in percentage points between the TSLA stock performance and strategy performance
- Accuracy score is the number of correct predictions divided by the number of total predictions
Data
Stock data was obtained with the yfinance library, which utilizes the Yahoo Finance API and Pandas to allow one to easily download stock data to a DataFrame:
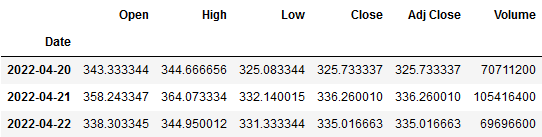
Data downloaded with yfinance contains no missing values but frequently calculations to the data create missing values, such as adding price lags and calculating moving averages. These null values always occur at the head-end and are least important for the purposes of this project, and thus deleted.
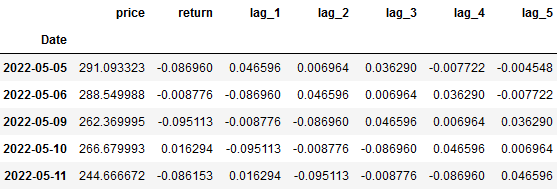
I wanted to start with simple techniques as well as a simple dataset, so only the closing price (‘Adj Close’) was retained. Feature engineering began with creating a daily ‘return’ (% change) and creating ‘lags’ of those returns in an attempt to create a pattern leading to the sign of the return:
Exploratory data analysis and visualization
Various market indicator data was explored including US Treasury data and Financial Industry Regulatory Authority (FINRA) data, but a comparison with TSLA stock did not reveal useful insight.
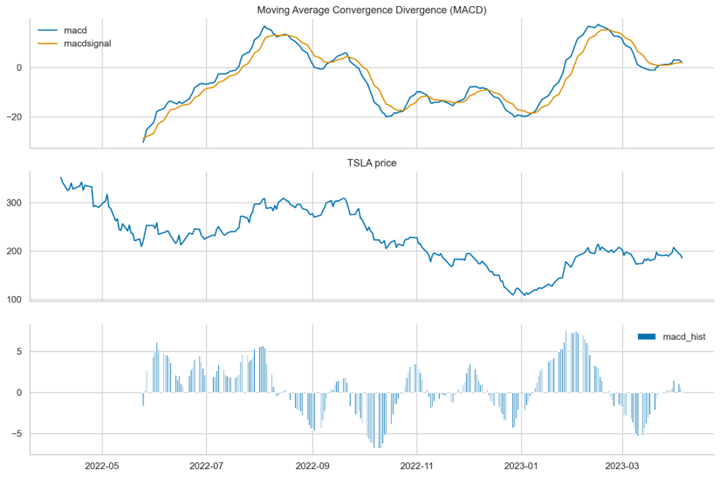
Several market indicators were also explored including volatility, relative strength index, Bollinger bands, moving average convergence divergence (MACD), and candlesticks. While many of those showed promise, the MACD was easiest to understand and incorporate during later stages.
Modeling of investment strategies
Investment strategies modeled include:
- Indicator Strategies
- MACD
- Momentum
- Linear Regression (ordinary least squares)
- Logistic Regression (Sklearn)
- Deep Learning (Keras)
After reviewing modeling results, I adjusted the approach to the problem by adding features, adding lags of those features, and choosing a new classification algorithm:
- Features (10 lags each)
- Rolling volume
- Rolling daily minimum price
- Rolling daily maximum price
- MACD buy/sell signal
- AdaBoost() classification algorithm
Evaluation
The full results are shown in the table below. As the models increased in complexity (deep learning/revised approach), overfitting was apparent and financial performance on the test data was lowest among ML techniques. The revised approach provided the highest accuracy scores and the MACD strategy had the top overall financial performance.
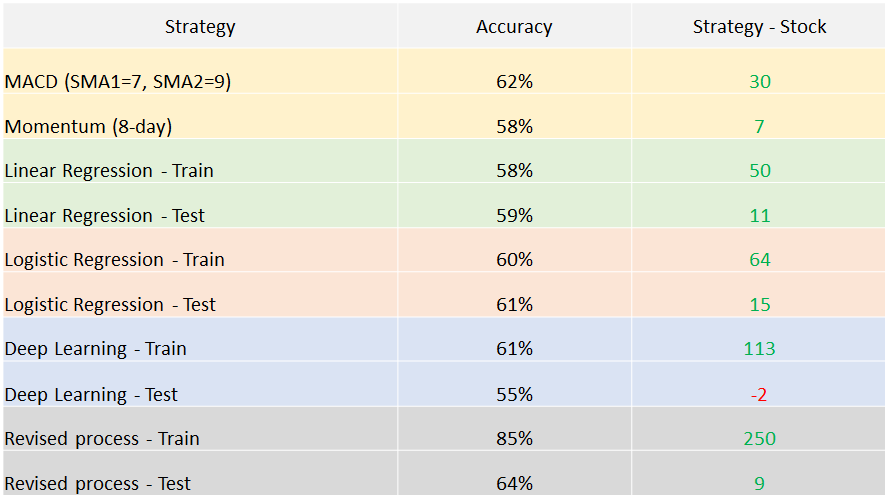
Regarding deployment, I believe much more analysis & insight is needed before any of these models can be relied upon for consistent positive returns.