Jump to: Quick start | Pipeline | Visualizer | Scripts | Files | Data sources | Citation | License
An interactive change-detection workbench for satellite imagery. Swipe between two dates of Sentinel-2, label pixels as "change" or "no change", train a logistic regression on AlphaEarth Foundations (AEF) embeddings, and see predictions update in real time — all in the browser via WebGPU (with a CPU fallback).
This repo provides:
- A Python data pipeline that downloads 64-band int8 AEF embeddings from the Zarr v3 mosaic on Source Cooperative, computes per-pixel temporal diffs, reduces them via PCA, and emits web-mercator tile pyramids
- A self-contained browser visualizer (
visualizer/index.html) — Leaflet + GeoTIFF.js + WebGPU, with side-by-side imagery comparison, click-to-label, in-browser logistic-regression training, and live per-pixel inference
ℹ️ The hosted demo at calebrob.com/deltabit is a polished build of the same index.html against bundled Seattle tiles. This repo lets you reproduce the pipeline + viewer end-to-end on any Sentinel-2 MGRS tile. See the accompanying blog post for background.
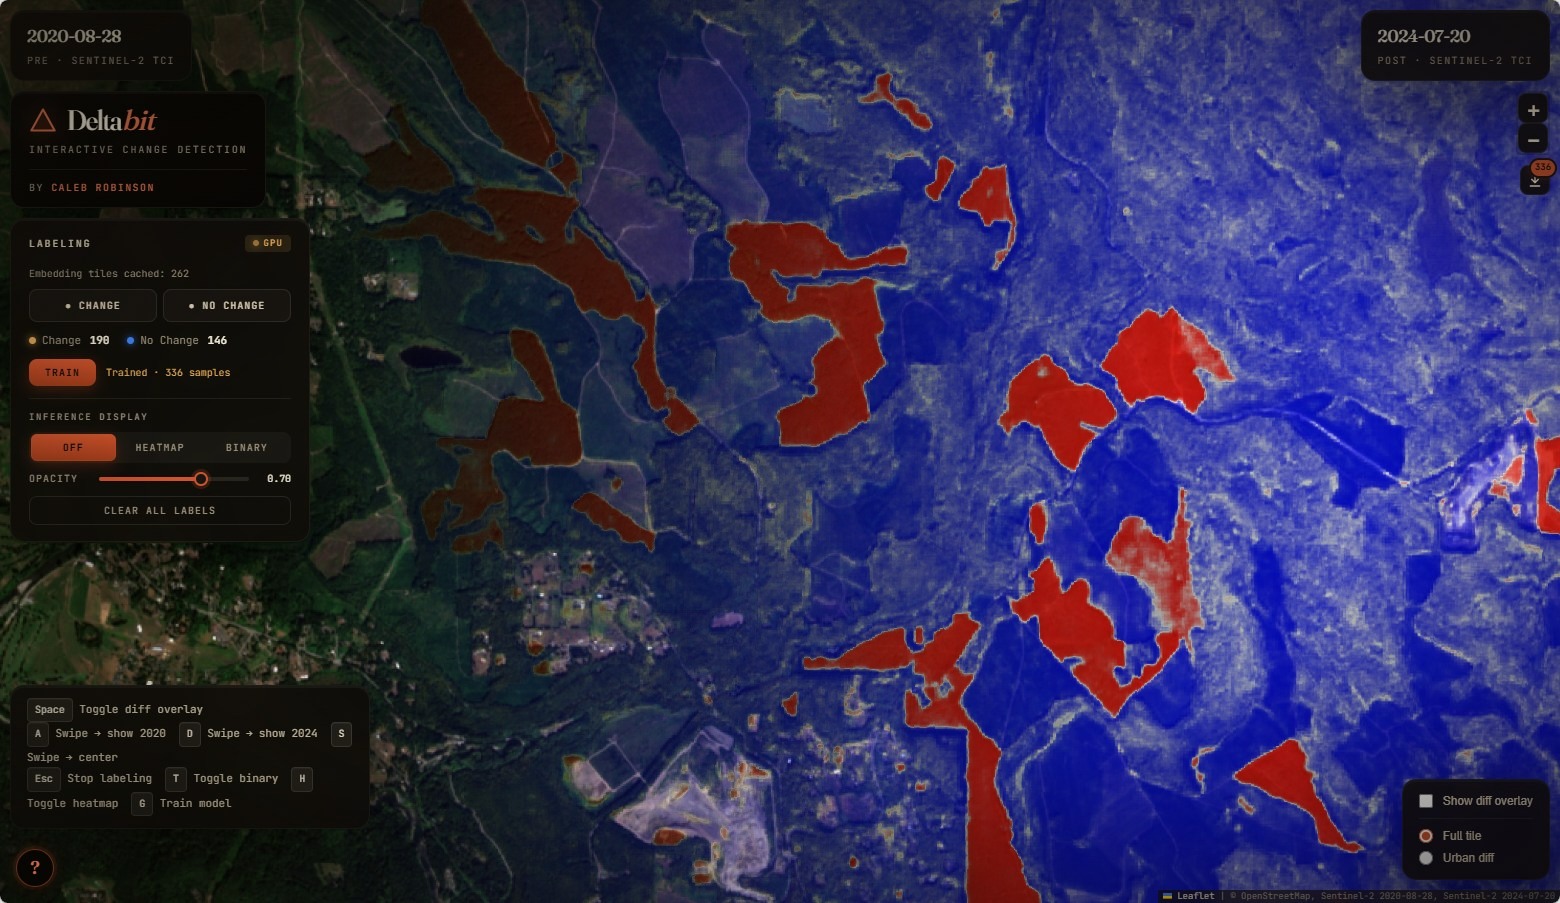
Figure 1. DeltaBit demo over Seattle (Sentinel-2, 2020 → 2024). The viewer fades from Sentinel-2 true-color imagery (left) into a per-pixel change-probability heatmap (right) produced by a logistic regression trained in-browser on a handful of click-labeled points over 64-band AEF embedding diffs.
The in-browser model is intentionally tiny — a logistic regression with L2 regularization fit by SGD on whatever points you've clicked. It handles classes that are linearly separable in the AEF embedding-diff space (e.g. "new construction vs. stable urban") well, but is not a general-purpose change detector. Treat it as an interactive labeling-and-exploration tool: a way to quickly see whether AEF embeddings can separate the kind of change you care about, before you go off and train something heavier offline. The committed point datasets in data/ are example labels exported from the hosted demo — useful as seeds for downstream work.
The fastest way to try DeltaBit is the hosted demo — no install required:
👉 calebrob.com/deltabit — labeling viewer over Seattle 2020 → 2024.
To run the same viewer locally against the same hosted tiles:
git clone https://github.com/calebrob6/in-browser-embedding.git
cd in-browser-embedding
python -m http.server 8000
# Open http://localhost:8000/visualizer/index.html
This serves visualizer/index.html and loads the bundled visualizer/configs/seattle.json, which points at hosted Seattle tiles. To run the data pipeline yourself for any other Sentinel-2 MGRS tile, install the conda environment and follow the Pipeline walkthrough:
Start by setting up the conda environment:
conda env create -f environment.yml
conda activate deltabit
The pipeline downloads 64-band int8 AEF embeddings from a public Zarr v3 mosaic on S3, computes per-pixel temporal diffs, reduces them via PCA, and slices the result into web-mercator tile pyramids that the browser viewer can stream:
download_aef_geotiff.py     64-band AEF embedding GeoTIFF per year
         │
         ▼
     pca_diff.py             Per-pixel diff of two years → PCA reduction
         │
         ▼
 make_geotiff_tiles.py       Slice → {z}/{x}/{y}.tif (or .png) web-mercator pyramid
         │                       │
         ▼                       └─ also used to tile S2 true-color scenes (.png)
   visualizer/index.html      Leaflet + GeoTIFF.js + WebGPU viewer reads the pyramid
generate_aef_map.py wraps the download + diff + PCA steps into a single command. download_s2_scene.py fetches matching low-cloud Sentinel-2 true-color scenes for the side-by-side imagery.
# 1. Download Sentinel-2 true-color scenes (least-cloudy per year)
python download_s2_scene.py --tile T10TET --year 2020 2025

# 2. Download AEF embeddings (64-band int8 GeoTIFFs)
python download_aef_geotiff.py --tile T10TET --year 2020 2025

# 3. Compute embedding diff → PCA reduction
python pca_diff.py aef_10TET_2020.tif aef_10TET_2025.tif -n 3

# 4. Generate tile pyramids
#    Embedding diff (GeoTIFF — used by the labeling viewer)
python make_geotiff_tiles.py aef_diff_pca3_10TET_2025_minus_10TET_2020.tif -o tiles/

#    Sentinel-2 imagery (PNG — used for side-by-side comparison)
#    (alternatively: `gdal2tiles.py --xyz -z 8-14 s2_10TET_20200828.tif tiles/s2_2020/`)
python make_geotiff_tiles.py s2_10TET_20200828.tif -o tiles/s2_2020/ --png
python make_geotiff_tiles.py s2_10TET_20250720.tif -o tiles/s2_2025/ --png

# 5. Write a config pointing at your local tiles
cat > visualizer/configs/local.json <<'JSON'
{
    "name": "Local 10TET (2020 → 2025)",
    "embeddingTileUrl": "../tiles/{z}/{x}/{y}.tif",
    "leftTileUrl":      "../tiles/s2_2020/{z}/{x}/{y}.png",
    "leftLabel":        "2020-08-28",
    "rightTileUrl":     "../tiles/s2_2025/{z}/{x}/{y}.png",
    "rightLabel":       "2025-07-20",
    "mapCenter":        [47.355, -122.267],
    "mapZoom":          10
}
JSON

# 6. Launch the viewer
python -m http.server 8000
# Open http://localhost:8000/visualizer/index.html?config=configs/local.jsonEvery script accepts a --tile flag with any Sentinel-2 MGRS tile ID (e.g. 33UUP, T32TQM, 10SGD):
python download_s2_scene.py    --tile 33UUP --year 2019 2024
python download_aef_geotiff.py --tile 33UUP --year 2019 2024
python pca_diff.py aef_33UUP_2019.tif aef_33UUP_2024.tif -n 3
python make_geotiff_tiles.py aef_diff_pca3_33UUP_2024_minus_33UUP_2019.tif -o tiles/
Or do steps 1–3 in one shot with generate_aef_map.py:
python generate_aef_map.py --tile 33UUP --year-a 2019 --year-b 2024 -o diff_33UUP.tifThe HTML viewer (visualizer/index.html) is fully self-contained — no build step, no bundler. It uses Leaflet + GeoTIFF.js + WebGPU (CPU fallback) and loads embedding tiles as {z}/{x}/{y}.tif pyramids.
- GeoTIFF.js decodes the requested 64-band int8 embedding tiles client-side and caches the raw byte buffers in memory.
- Click-to-label drops a marker, samples the underlying tile at that pixel, and pushes a
(64-d embedding, 0/1 label)row into a sample buffer. - Train z-score normalizes the features and runs a few hundred SGD epochs of L2-regularized logistic regression in pure JS (~ms-scale for hundreds of samples).
- Inference runs the trained linear model on every loaded tile — via a WebGPU compute shader when available (workgroups of 256 invocations, one per pixel), or a CPU loop as a fallback. Outputs are recolored on the fly into either a binary mask or a diverging blue → white → red heatmap.
- Tile-URL override in the labeling panel lets you swap the embedding source at runtime without reloading.
Because it's all client-side, swapping AOIs is just a matter of pointing the viewer at a different tile pyramid via a config file.
When the page loads you'll see two Sentinel-2 dates side-by-side, separated by a draggable swipe handle. Drag it (or use A / D / S) to compare the two timestamps directly. To label and train:
- Click ● Change in the labeling panel and click on the map at a few pixels that changed between the two dates. Repeat with ● No Change for stable areas. ~10 of each is enough to get started.
- Click Train (or press
G). Training takes well under a second. - Switch the display mode to Heatmap (
H) or Mask (T) to see the trained model's per-pixel prediction across the loaded tiles. - Iterate: add more labels in regions where the model is wrong, retrain. The threshold slider lets you trade off precision/recall on the binary mask.
Tile URLs and map settings are loaded from a JSON config file. The default is visualizer/configs/seattle.json; pass ?config=<url> to load a different one (the path is resolved relative to index.html):
visualizer/index.html                          # uses configs/seattle.json
visualizer/index.html?config=configs/foo.json  # custom config in this repo
visualizer/index.html?config=https://example.com/cfg.json
| Field | Required | Description |
|---|---|---|
name |
Human-readable label for the config | |
embeddingTileUrl |
✓ | URL template for 64-band int8 embedding GeoTIFF tiles |
embeddingMinZoom |
Min zoom for embedding tiles (default 8) |
|
embeddingMaxNativeZoom |
Max native zoom for embedding tiles (default 14) |
|
leftTileUrl |
✓ | URL template for the "pre" Sentinel-2 imagery PNG tiles |
leftLabel |
Label shown for the pre image (default pre) |
|
rightTileUrl |
✓ | URL template for the "post" Sentinel-2 imagery PNG tiles |
rightLabel |
Label shown for the post image (default post) |
|
mapCenter |
✓ | Initial map center as [lat, lng] |
mapZoom |
Initial map zoom (default 10) |
|
tileBounds |
[[south, west], [north, east]] clamp for tile loading |
URL templates use Leaflet's {z}/{x}/{y} placeholders. Example:
{
    "name": "My AOI",
    "embeddingTileUrl": "https://example.com/tiles/diff/{z}/{x}/{y}.tif",
    "leftTileUrl":      "https://example.com/tiles/2020/{z}/{x}/{y}.png",
    "leftLabel":        "2020",
    "rightTileUrl":     "https://example.com/tiles/2024/{z}/{x}/{y}.png",
    "rightLabel":       "2024",
    "mapCenter":        [47.355, -122.267],
    "mapZoom":          10,
    "tileBounds":       [[46.85, -123.0], [47.85, -121.5]]
}
If the config fails to load or is missing a required field, the viewer displays an in-page error message instead of the map.
- AEF embeddings — AlphaEarth Foundations Mosaic on Source Cooperative (anonymous S3, no credentials). Coverage spans 2017–2025 at 10 m resolution on the Sentinel-2 grid.
- Sentinel-2 imagery — Element 84 Earth Search STAC catalog (Sentinel-2 L2A collection), no credentials needed.
If you use this repo, please cite it:
@misc{robinson2026deltabit,
  author       = {Robinson, Caleb},
  title        = {{DeltaBit}: in-browser change detection on {AlphaEarth} embeddings},
  year         = {2026},
  howpublished = {\url{https://github.com/calebrob6/in-browser-embedding}}
}MIT — see LICENSE.